


12/02 Weekly Insights: New Features, SPX Analysis, and Educational Trade Ideas
Welcome to this week’s newsletter! In this edition, we’re excited to share the latest updates to our indicators, dive into an in-depth SPX market analysis, and explore an educational trade idea tailor

Hi Everyone,
We’re thrilled to announce some exciting updates to our seamless GEX indicator, rolling out today:
0DTE GEX Updates Now Available (5x Daily)
Starting today, intraday 0DTE GEX updates will refresh five times per day during market hours! This includes updates to 0DTE chain data alongside other GEX levels.
No manual updates needed: The changes will automatically sync within your indicators.
Dynamic level adjustments: Keep in mind that the GEX levels fixed at the start of the day might shift, especially with 0DTE updates, which can move rapidly.
Our benchmarks suggest that while the key levels set at market open generally remain consistent, the strength of resistance levels may fluctuate. We’ll be testing this together with you—it’s going to be an exciting week ahead!
But Wait, There's More - today evening
Based on your feedback, we’ve added two major enhancements to the indicator:
Normalized NETGEX Values for Each Expiration
After today’s market close (!!!), a new update will roll out to display normalized NETGEX values per expiration. This will help you easily identify which expirations are critical and whether the NETGEX is significantly positive or negative for each.
Where to find it: This feature will appear embedded in the oscillator on the right-hand side. Don’t forget to refresh the oscillator after market close to access it!
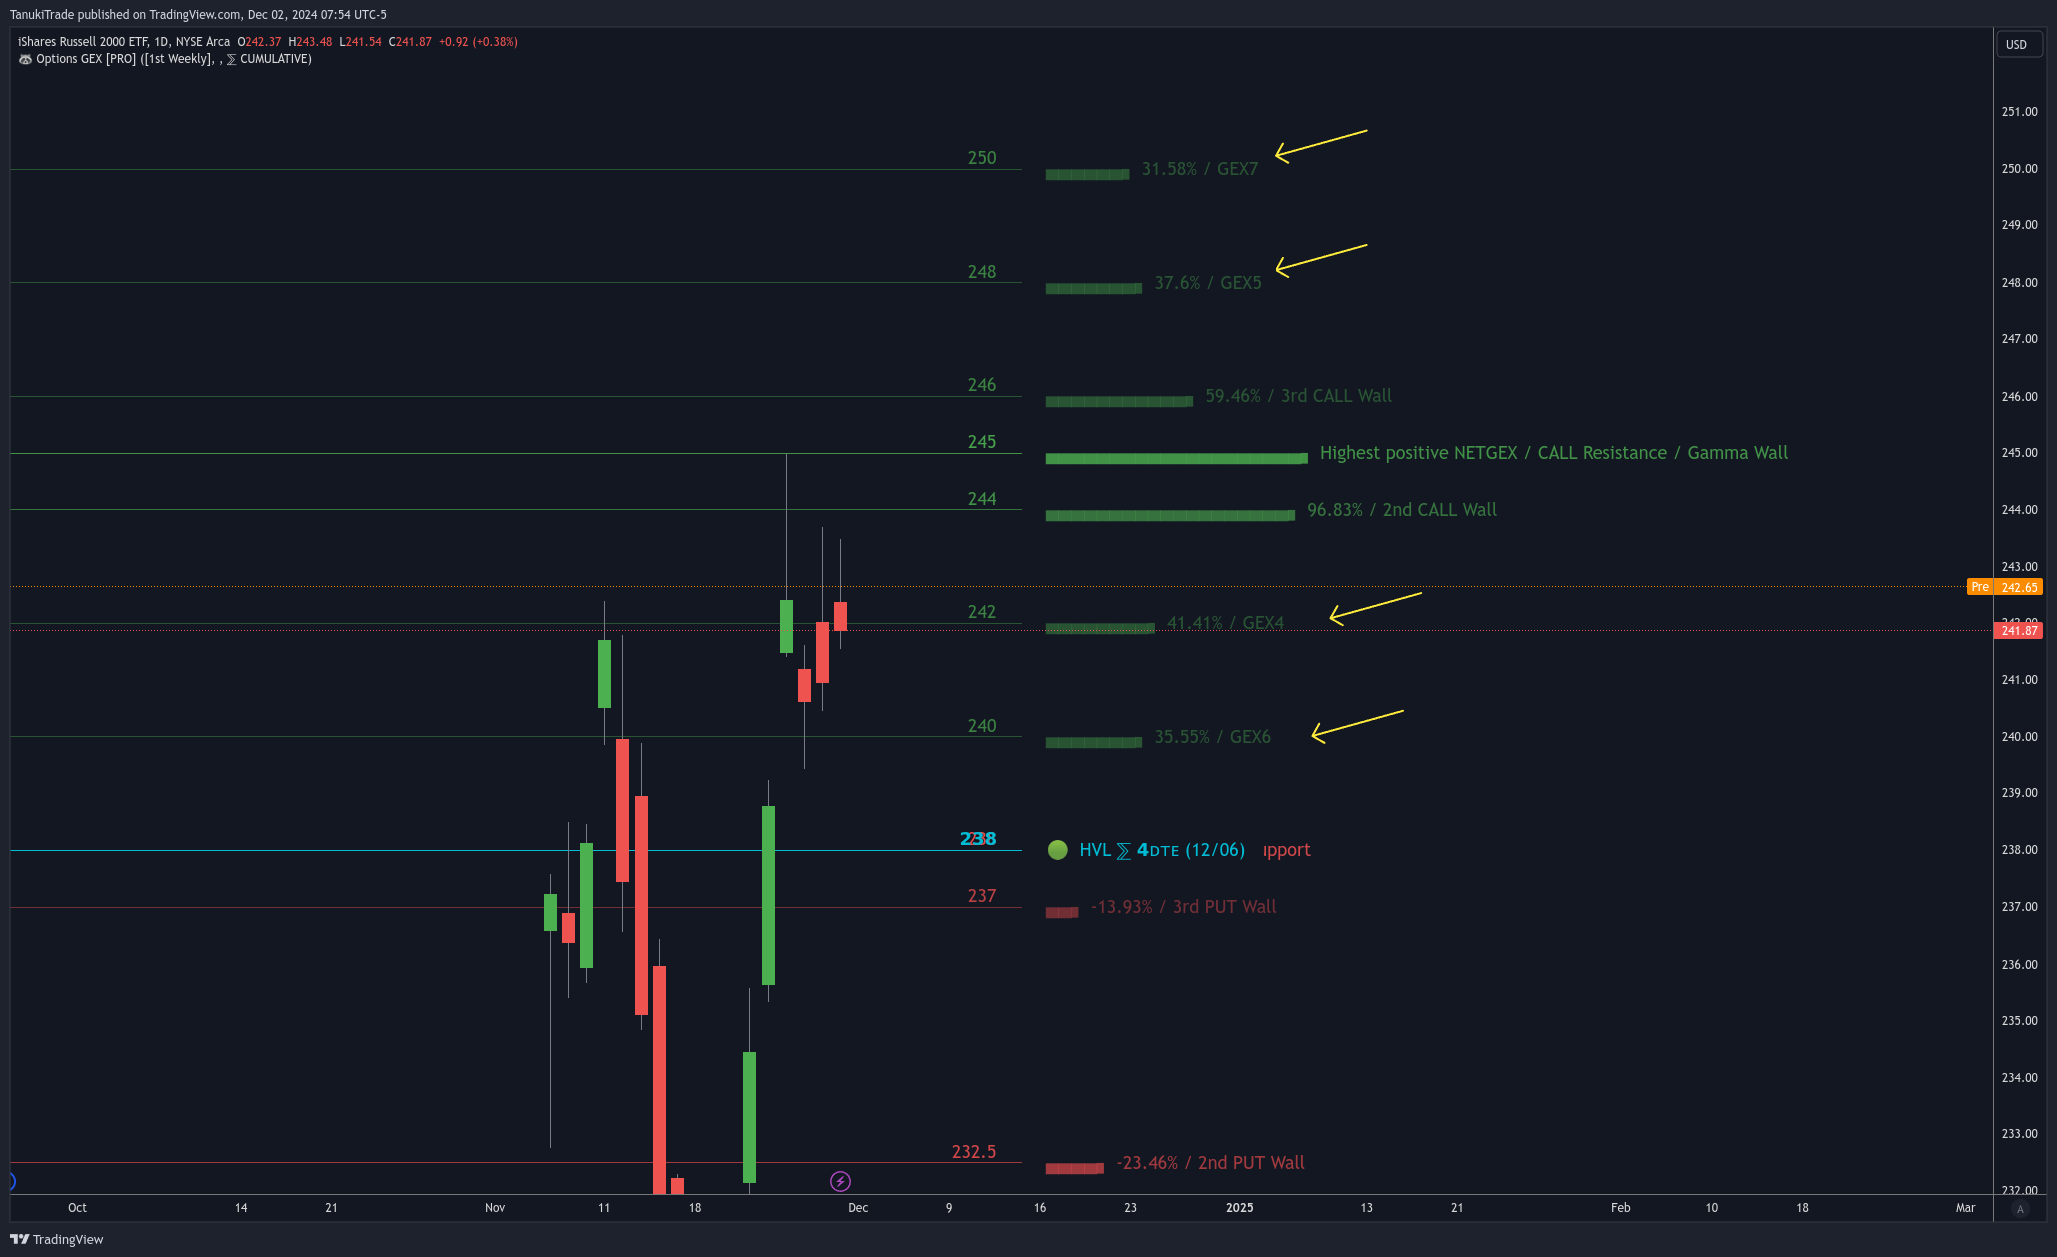
Four Additional Key GEX Levels
We’ve included four major GEX levels ranked by their significance, now visible directly in the GEX indicator. - After today’s market close (!!!)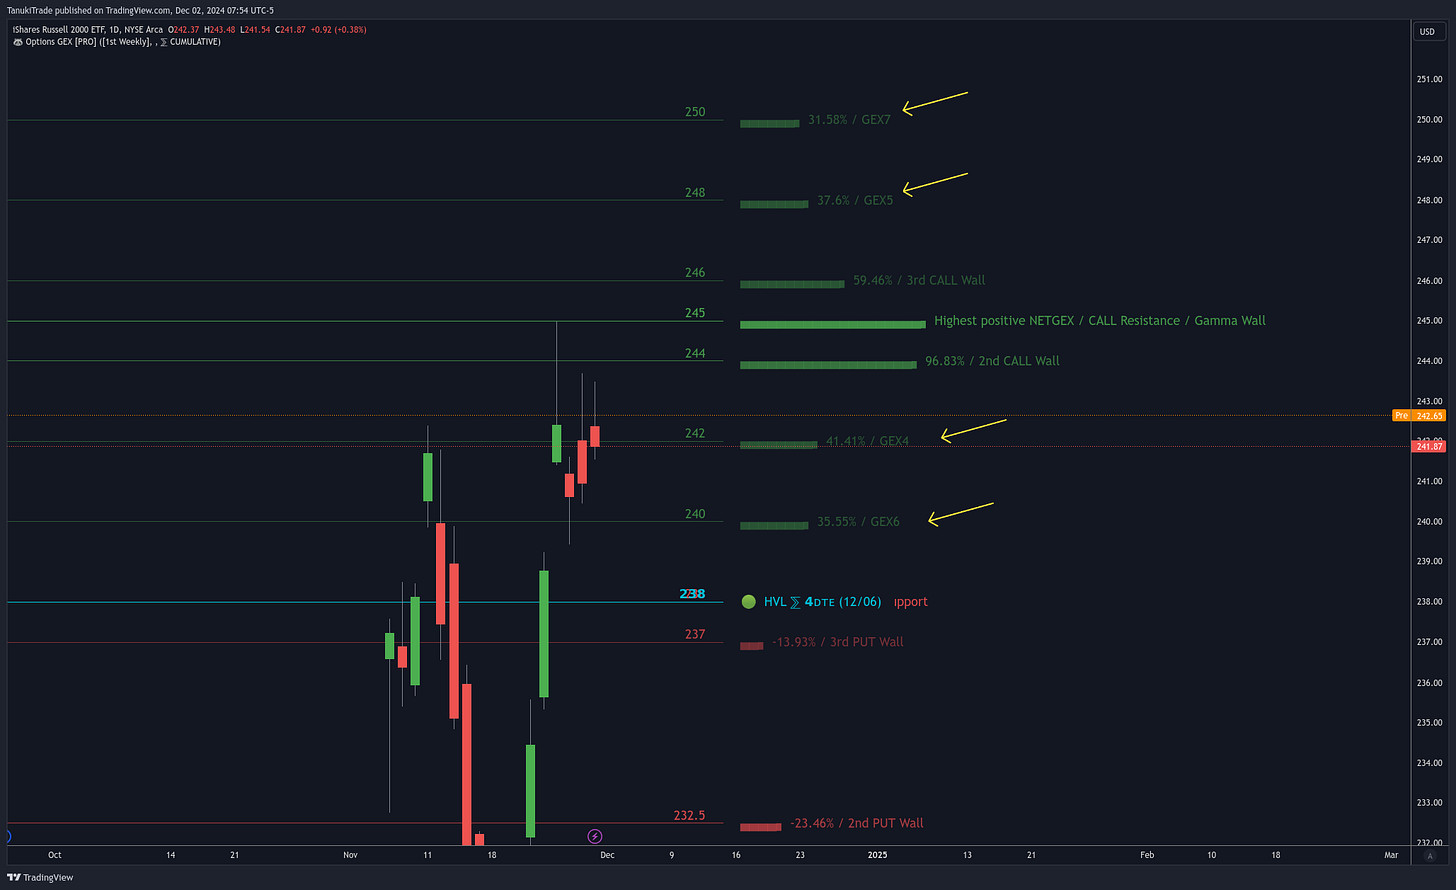
These updates aim to give you deeper insights into hidden levels and key expirations in the market. More detailed explanations will be available in the indicator descriptions and tooltips.
Let’s dive into this week’s SPX analysis using our new tools!
Weekly SPX Analysis – Leveraging Our New Features
Thanks to our support for SPREADEX:SPX, we now have access to detailed pre-market SPX analysis, clearly illustrated below:
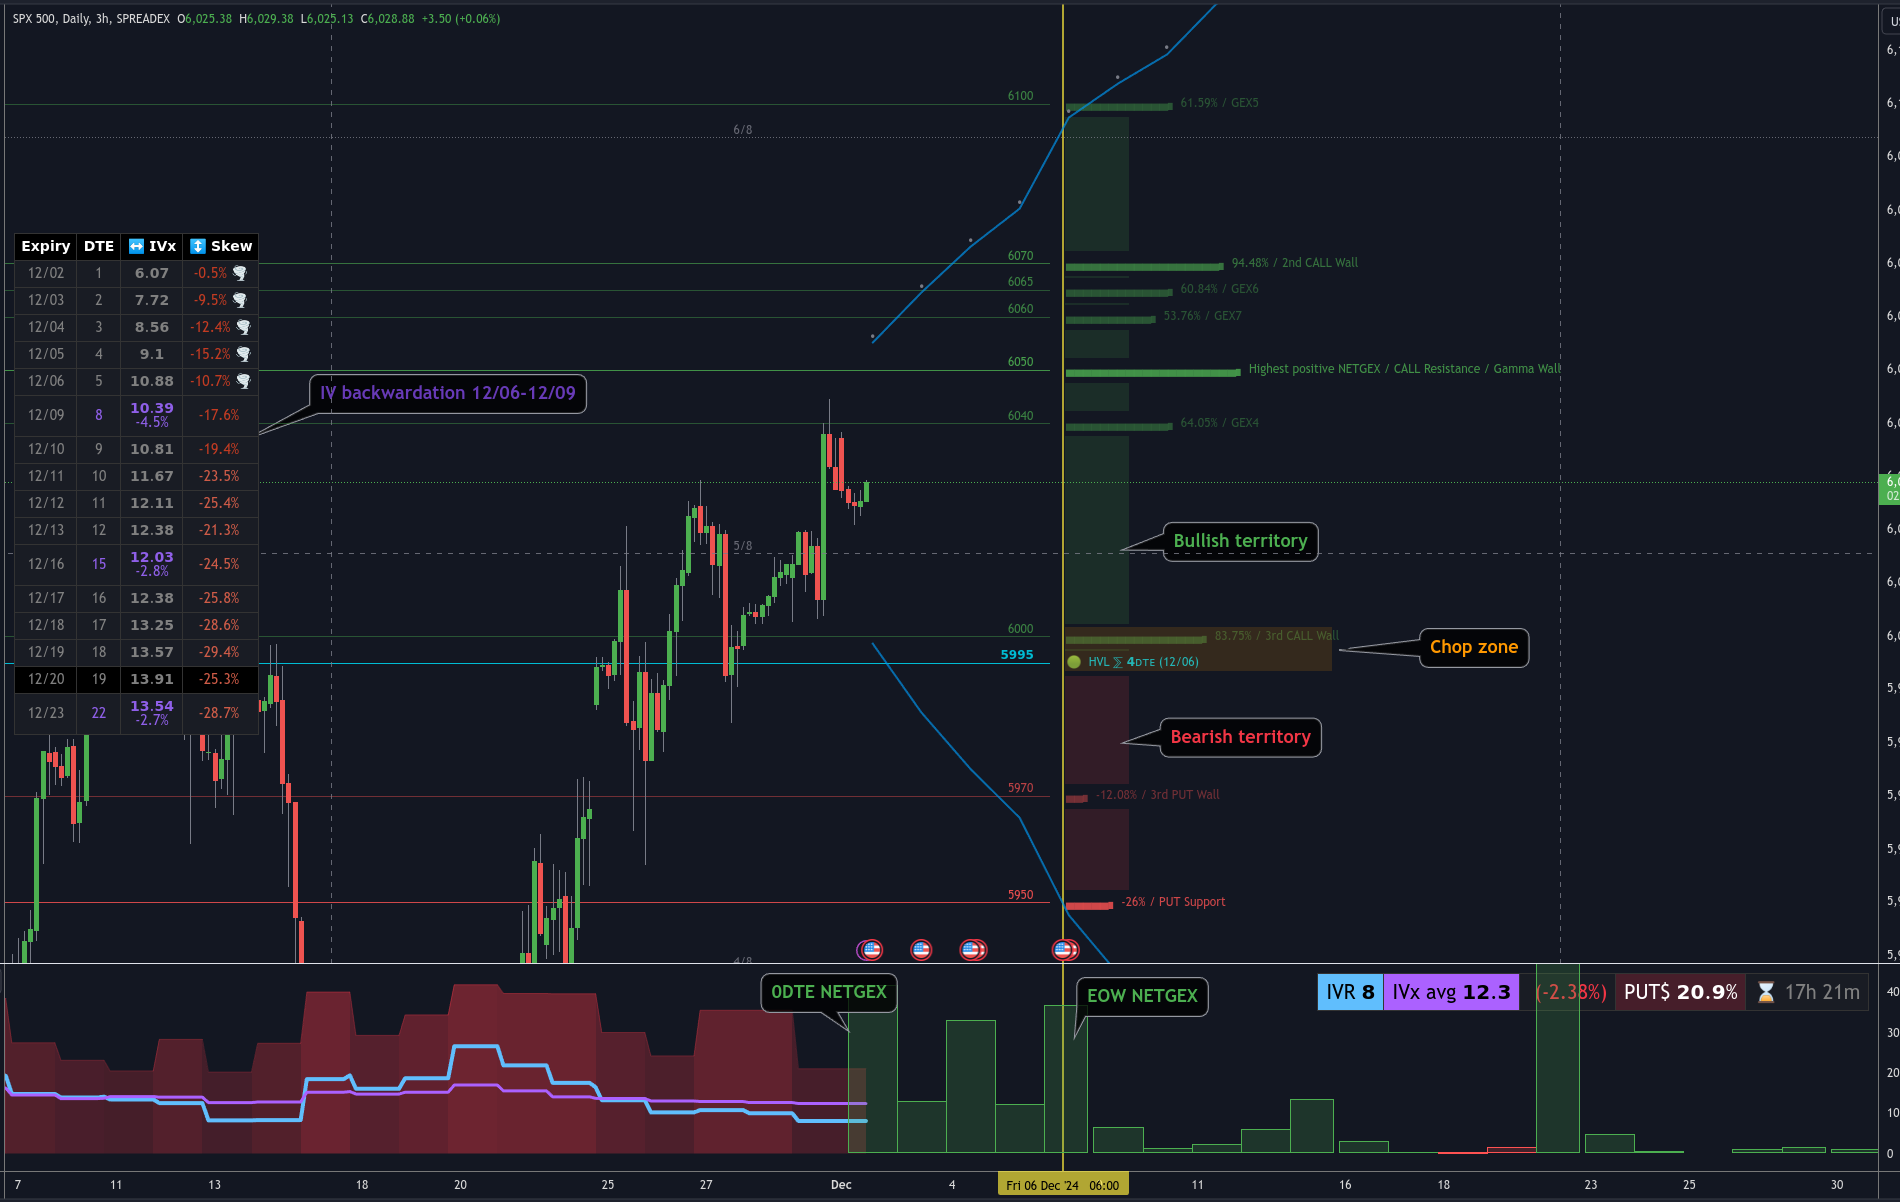
The weekly expected move (blue OTM16 curve) lies between 5950 and 6100.
Key Levels for the Week:
Upside:
6050 is the highest call gamma wall. Breaking through this level could pave the way to 6070, and if FOMO kicks in, even to 6100. However, heavy resistance is already being built by market makers around 6070, so watch this level closely.
Volatility Zone:
The 5995–6000 area marks the highest volatility zone.
Important Note: This does not indicate that NETGEX is positive above this zone and negative below. It simply means that reaching this level will cause the NETGEX profile to turn increasingly negative.
Downside:
5950: The largest put support level and an easy downside target for the week if the market breaks lower.
IV Analysis
IV Backwardation:
Clear IV backwardation is present between this week’s Friday expiration and next Monday’s expiration. This is favorable for time spreads, with Monday’s IV being 4.5% lower than Friday’s.
Put Pricing Skew:
At the start of the week, there’s a very mild put skew, suggesting that market participants are not particularly concerned about downside risk. The sentiment is strongly bullish.
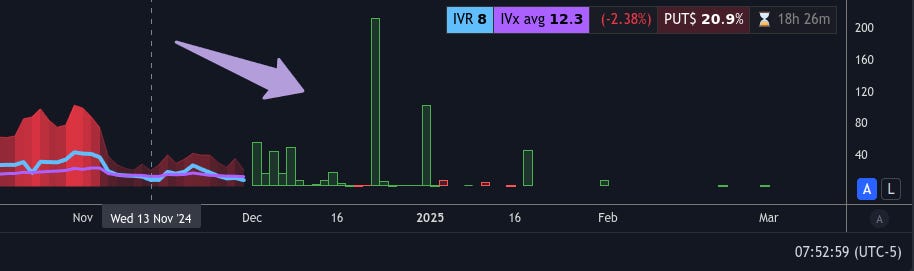
IV Rank and IVx:
The IV Rank stands at a low 8, and the overall IVx is 12, both of which support a bullish setup.
Notice how much clearer these insights are compared to before? Don’t worry—after market close, the latest updates for both the Oscillator (below) and the GEX Indicator (on the chart) will be available to you!
Weekly Event Risks and Notable Earnings
This week brings a few economic events, with Wednesday and Friday standing out as particularly noteworthy. Here's a snapshot of the upcoming events:
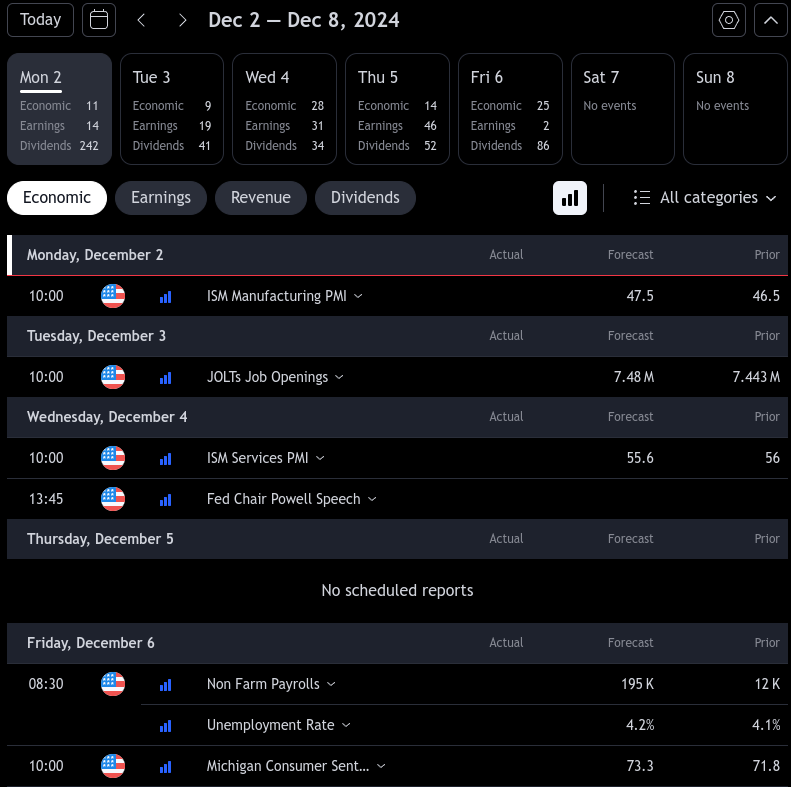
Remember: We monitor these events not to avoid trading during such times, but to prepare for potential significant market movements.
Regarding earnings, it's a relatively quiet week. However, two companies are worth mentioning:
Marvell Technology ( MRVL 0.00%↑ ): Scheduled to report earnings on Tuesday, December 3, 2024, after market close.
Salesforce ( CRM 0.00%↑ ): Also set to announce earnings on Tuesday, December 3, 2024, after market close.
Educational Trade Idea for the Week
This week, I’ve prepared an educational trade setup to illustrate how to leverage the current low IV, IV backwardation, and a bullish market environment.
Disclaimer: These examples are strictly for educational purposes and should not be considered investment advice. Please avoid blindly opening positions based on these illustrations. If you’re not familiar with how timespread characteristics can change significantly in different scenarios, I recommend testing these trades in a demo account or on platforms like OptionStrat.
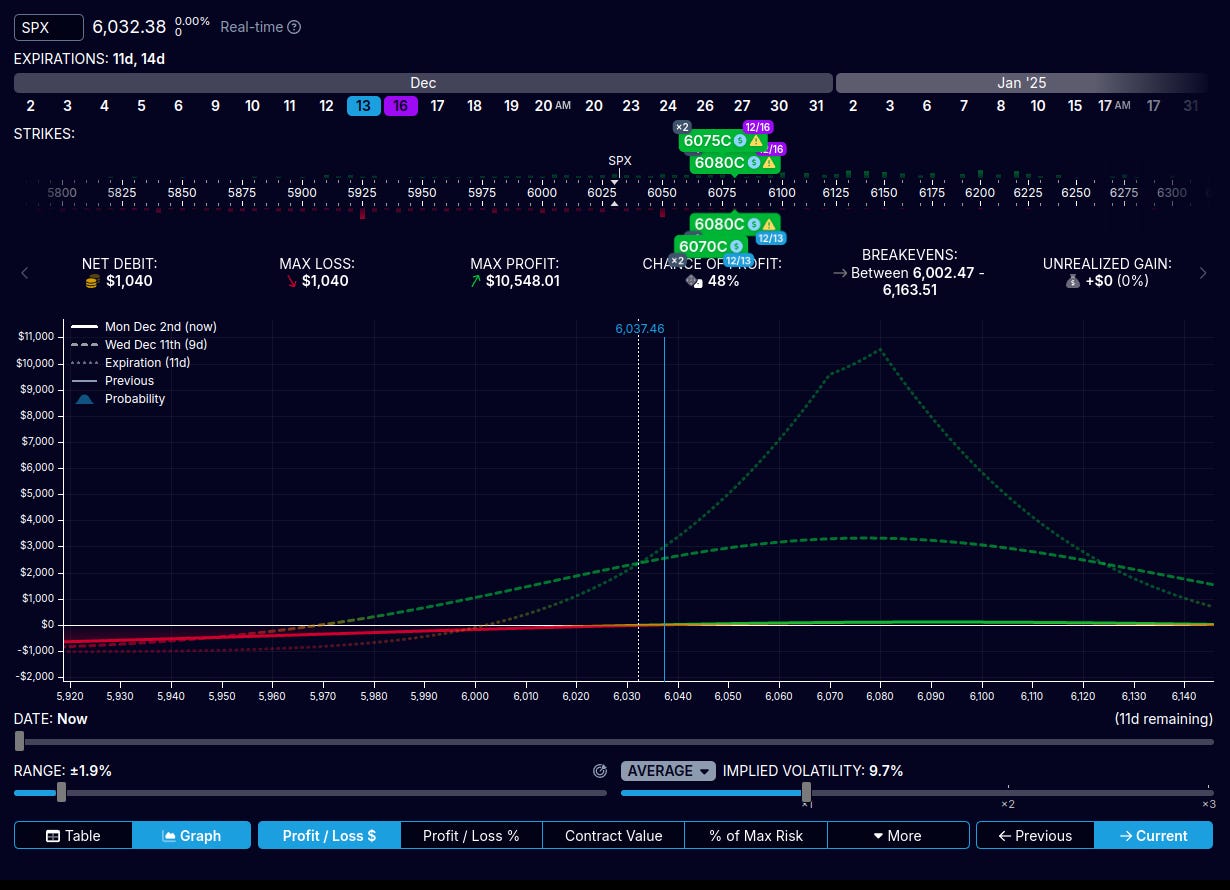
Trade Setup: Bullish Diagonal + Calendar Combo
We’ll explore not one but two setups, both sharing the same strike prices:
Strike Prices and Quantities:
Front Expiry: -2 x 6070, -4 x 6080
Back Expiry: +2 x 6075, +4 x 6080
This setup results in 2 diagonals and 4 calendars, split and analyzed across two timeframes: 4/7DTE and 11/14DTE.
Why this combo instead of focusing on just one?
The goal is to mitigate the weaknesses of each individual strategy:
Diagonal: If the spot price moves upward too quickly and hits the short strike, the position can turn negative.
Calendar: If the price dips slightly, the position can lose significantly due to its directional nature.
By combining these, we balance their advantages and disadvantages, creating a more robust strategy.
TEST CASE [A] Closer Expiration Combo (4/7DTE)
Pros:
Shorter duration, quicker to resolve.
IV backwardation is expected to increase the front expiration IV significantly this week.
Cons:
Higher risk of floating losses if the price doesn’t behave as expected.
If the price rises to the short strikes by Tuesday or Wednesday, you may need to scale out or close to lock profits.
Risk/reward ratio is less favorable, and downside movement can be more dangerous.
TEST CASE [B] Closer Expiration Combo (11/14DTE)
Pros:
The flatter profit curve makes this setup more forgiving if the price remains within the bullish range.
Better risk/reward ratio compared to the closer expiration.
Easier to manage due to lower theta decay pressure.
Cons:
Slower profit realization.
Fast upward price moves may require adjustments to realize profits effectively.
Let’s Test It Together
I encourage you to test both setups on OptionStrat and share your thoughts. I’ll consolidate feedback and include conclusions in next week’s newsletter.
What Do You Think?
Did you find this week’s newsletter helpful?
Is there a specific topic you’d like me to cover in future newsletters?
Should I write newsletters more often, or is twice a week already too much?
Feel free to share your feedback in the comments section below or reply directly to this email—I read every response and appreciate constructive criticism!
A Quick Note on Symbols and Feature Requests
I’ve received numerous symbol requests and development suggestions from many of you—thank you for your enthusiasm! While I strive to address as many as possible, our primary goal is to support multi-leg options traders who know what they’re looking for.
Symbol Liquidity Requirement: Going forward, we will only consider symbols with a Tastytrade 4/4 liquidity rank for inclusion.
No Futures Support (for now): Please refrain from futures-related requests, as we won’t be able to integrate them in the near future.
Thank you for your continued support and positivity—it’s what drives me and my team to maintain this level of development! 😊
I think the newsletter is great. The combination of theory and practice.
I would have liked a hint on how you manage the two trades. Do you have a fixed take profit? When do you exit the trade if the trade goes against you?
I could read this newsletter every day, but I don't want to keep you from the development of the indicators.
A list of all the trades presented would certainly be exciting too. That creates trust when the results are positive. And motivates new interested parties to take an interest in options.
Excelente Boletín, gracias. Es la primera vez que lo leo y es el mejor de los que he visto. Enhorabuena por las herramietas para Tradingview, les he estado echando un primer vistazo y son lo mejor que he visto para operar opciones. Me suscribo a la versión pro.