
09/08 DEX and GEX in 0DTE SPX – with Practical Examples - Part 2
🔍 0DTE GEX & DEX Mysteries, Part II

This week we continue our series on the hidden structures of 0DTE GEX & DEX, this time focusing on practical examples where the GEX profile is positive.
Below, we’ll focus only on analyzing 0DTE GEX and DEX profiles, since that’s where the largest options volume is concentrated — and within that, only SPX, as this is where the patterns are most pronounced (due to the relatively high price, the large number of strikes, and the purely options-driven volume).
📘 Pattern #1: The “Textbook” Outlook
This is the version where everything lines up perfectly. I’ll show you the ideal model, and more importantly, how to recognize it.
But what makes it “ideal”?
Because within this setup we can determine the daily range and the likely hedging flow activity with the highest probability.
See Examples below (1/A, 1/B, 1/C):
Key criteria:
Call resistance sits above HVL & put support sits below HVL
(PS < HVL < spot price < CR)Overall Net GEX is positive → we’re in a positive gamma regime, where market makers dampen retail moves below the Call Resistance(CR)
The transition zone is relatively narrow, and price trades above it
Strikes line up clearly across GEX, DEX, and OI (same-colored peaks stand out strongly)
If price approaches call resistance, NetOI, GEX, and DEX all spike at the same strike, signaling a critical level
⚙️ How to Trade Pattern #1
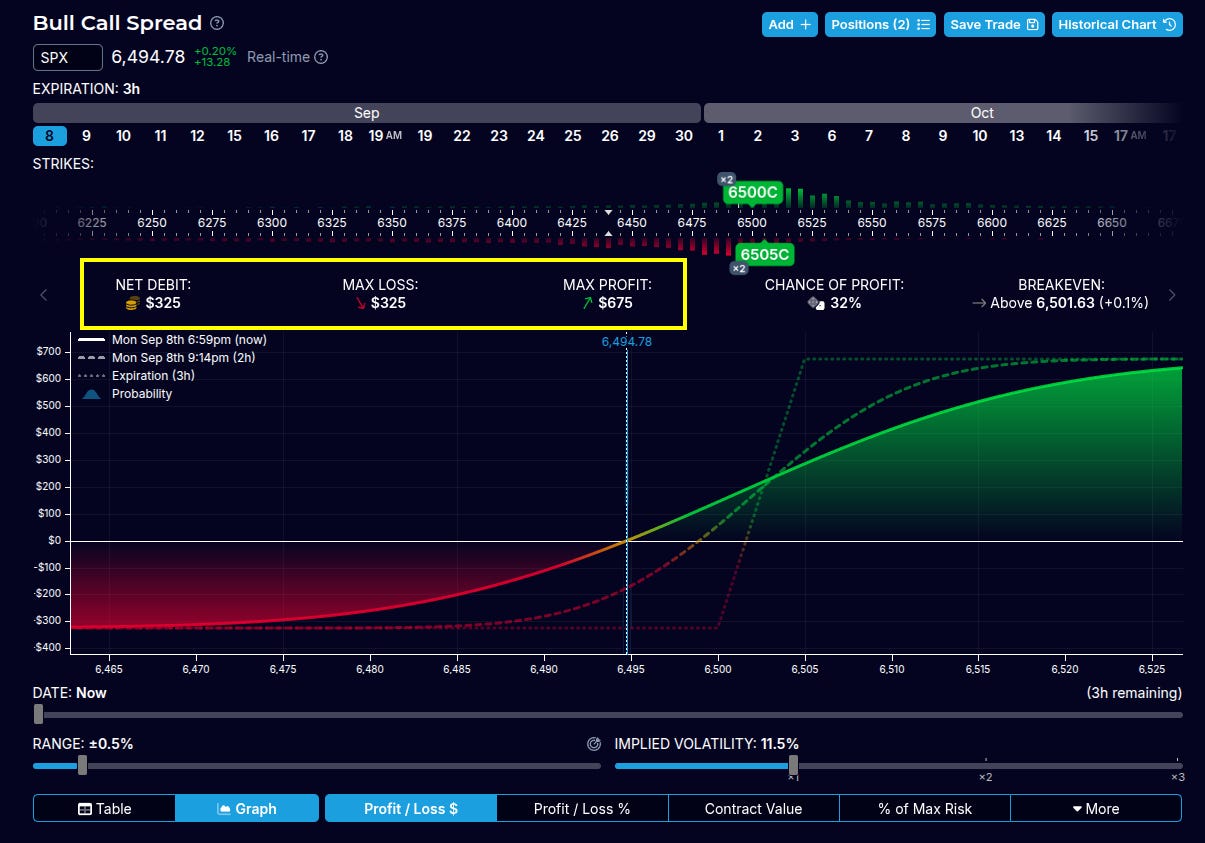
Personally, I prefer slightly OTM debit vertical spreads with good risk/reward. I usually take them in pairs (to allow scaling out).
Example setup:
Allowing for ~10pt downside risk (previous swing low)
Looking for ~15pt upside move
In other words: downside range = Y, upside range = Y × 1.6
Combined with a $200 max loss vs $400 max reward debit spread, this creates a 1:2 R:R, ensuring losses stay smaller than gains.
📊 Example chart setup if you’re unfamiliar:
🚦 What-If Scenarios for Your Trading Day
If we remain inside the range
(HVL < spot < CR):Look for bullish momentum up to call resistance (or the next call wall, or a technical high), then take full profit.
We generally don’t look for bearish setups inside this range. But—if you insist on playing to the downside—close no later than put support or the next call wall.
If price reaches Call Resistance
(spot = CR), what happens?Retail traders take profit (as significant OTM open interest flips ITM)
Market makers hedge aggressively by reducing delta, since they don’t want NetDEX exposure to skyrocket
These two forces combined make a reversal more likely than a continuation into a positive gamma squeeze
✅ Trading implications:
If you’re already long → take profit and step aside
If you’re flat → just wait
What exactly do we expect at Call Resistance
(spot = CR)?Bearish momentum → rejection:
If you’re risk-tolerant and have nerves of steel, you can look for short-term bearish momentum on smaller timeframes. The setup: trade the potential rejection back down toward the next call wall.
⚠️ But remember: if a positive gamma squeeze ignites, price can explode upward in an unexpected way. Keep your losses capped.Bullish momentum → squeeze release:
The very same CR level can also become the breeding ground for a short squeeze.
If the market is strongly bullish—whether due to news or pure sentiment—then even against hedging flows, buyers can push price higher. Once spot breaks above CR with momentum, market makers are forced to join the retail side, adding long exposure to manage positive gamma.
Result: price action mimics a negative GEX regime, except this time the explosive move is up, not down.
If price reaches Put Support (spot = PS):
If you were short → take profits and exit.
Then wait and watch how price behaves.
If you see bullish momentum, and both GEX and DEX confirm strength at PS, you can trade the rebound upward toward the next significant level (put wall, HVL, etc.).
⚠️ Stay realistic: don’t pick targets too far away, and don’t attempt this without a scale-out plan.
🧭 Recognizing the Textbook Pattern
The key is to learn how to identify setups that fit the Pattern #1: The “Textbook” Outlook —and always use the premarket layout as your starting point.
Let’s walk through examples:
📅 Example 1/a – Normal Range Day (Friday, Sept 5, 2025)
⚠️ Before we begin, an important note:
Gamma levels are not exact lines—they depend on strike spacing.In SPX, strikes are 5pts apart → each gamma level effectively has a ±2.5pt “radius.”
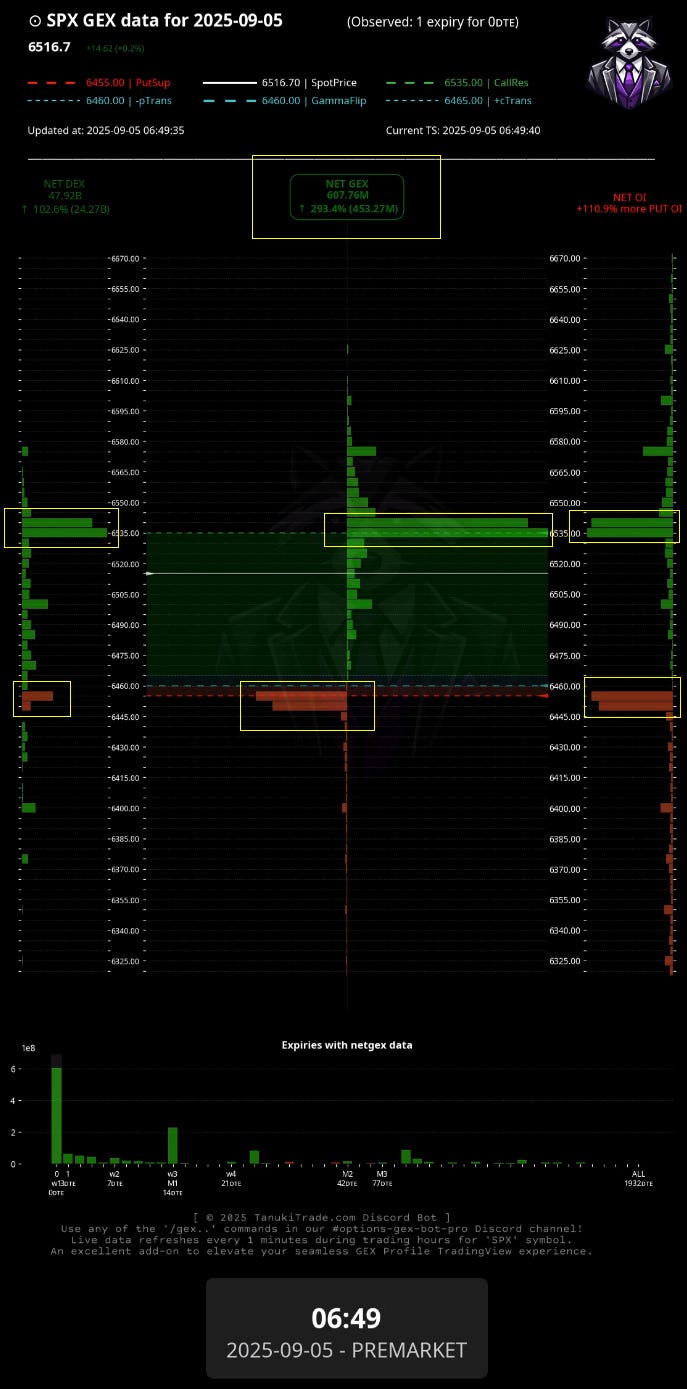
In this first case, you can already see it clearly: call resistance was so strong (due to the spike in DEX) that price bounced immediately upon approaching the range in premarket.
✅ Observations:
All criteria of the (1) textbook pattern are present.
The most significant gamma walls even appear almost doubled, just 5pts apart—another wall of equal strength sits right behind the first.
📌 My takeaway:
This tells me the GEX structure is stable and strong, and that heavy hedging activity can be expected whenever price approaches these levels.
Frankly, this is one of the most stable GEX setups you’ll ever see—it’s rare to find it this clean.
On the 3-minute chart:
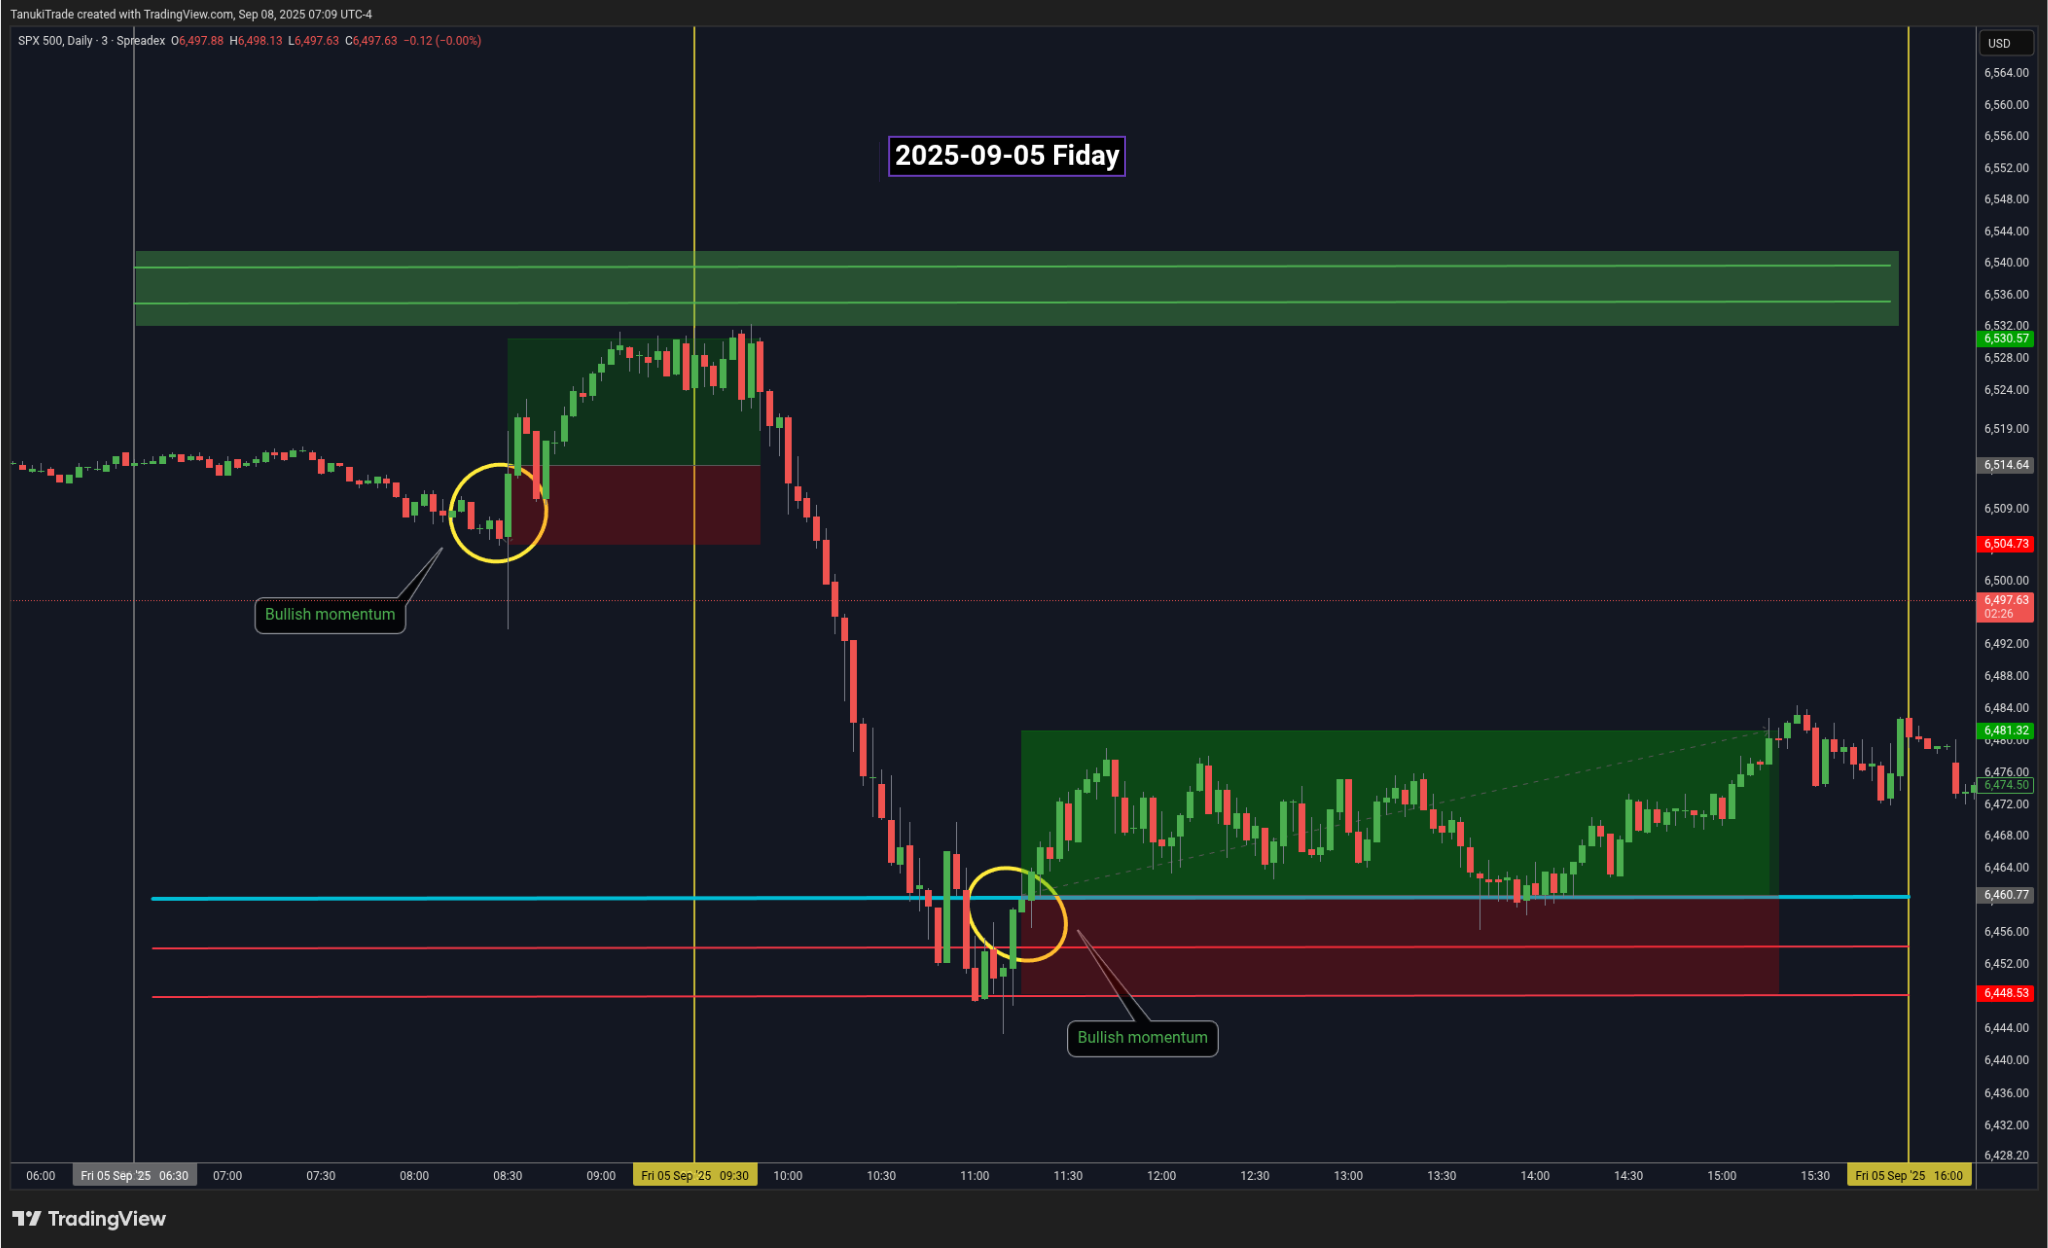
Major levels held beautifully.
Spot tested put support but was immediately pulled back up → which is why we don’t enter right at the touch, but only when confirmed bullish momentum appears.
As for call resistance: since price only “kissed” it from below, this wasn’t a clear bearish signal for me. I wouldn’t have looked for bearish momentum here, but you can also play it if you have good R:R setup.
🎥 For those who want to dive deeper, here’s the 1/a Recap Video:
https://discord.com/channels/1339175019640520765/1412400753410048051/1413620884236931194
📅 Example 1/B – Normal Range Day (Friday, Aug 5, 2025)
We already took a quick look at this day in last week’s letter, but since it fits perfectly here as another textbook case, I have to include it.
Opening bell GEX+DEX visualization (1/b):
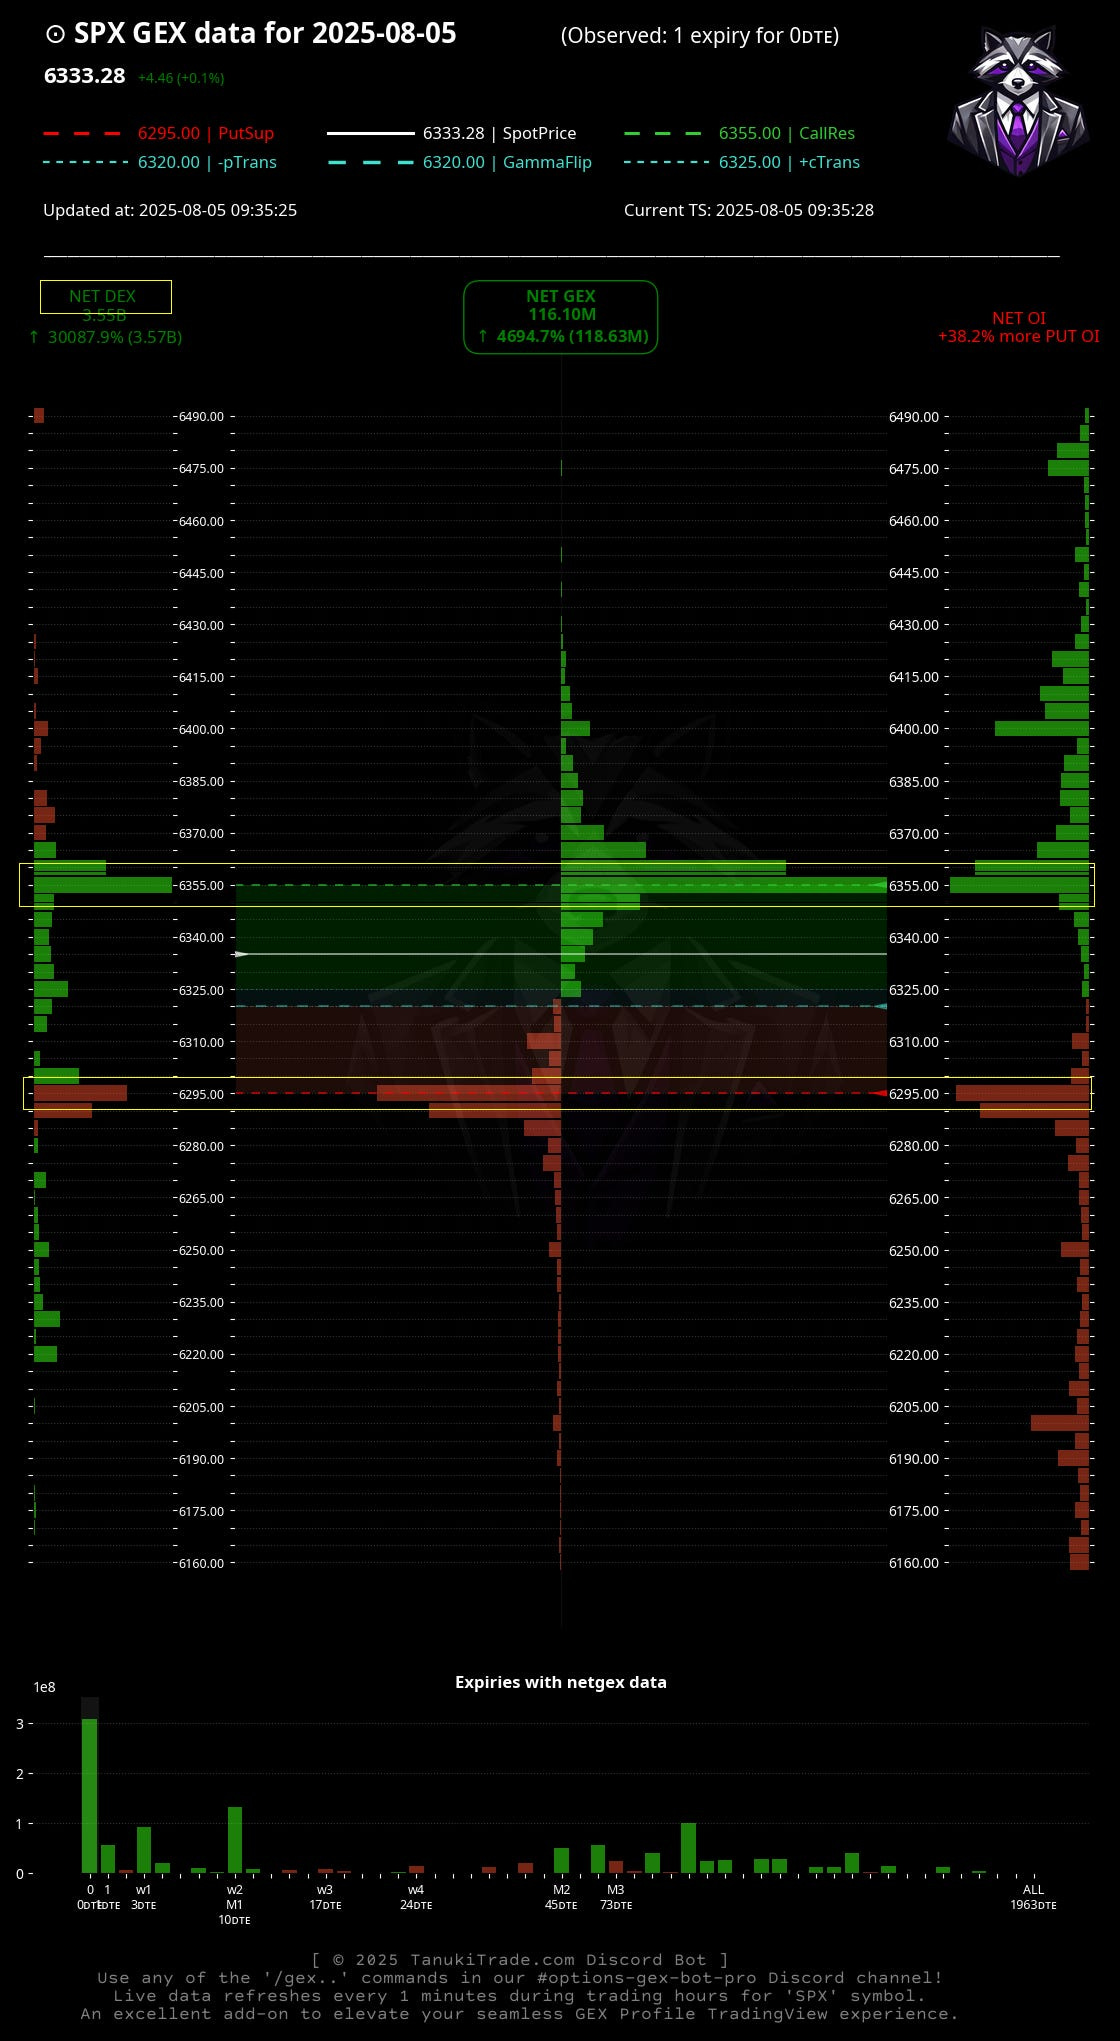
✅ Observations:
Significant GEX level, with DEX also massive compared to other strikes
Double protection on both sides
Positive NetGEX profile, with PS < HVL < spot price < CR satisfied
Setup bias: look for bullish momentum
15-min TradingView chart (1/B):
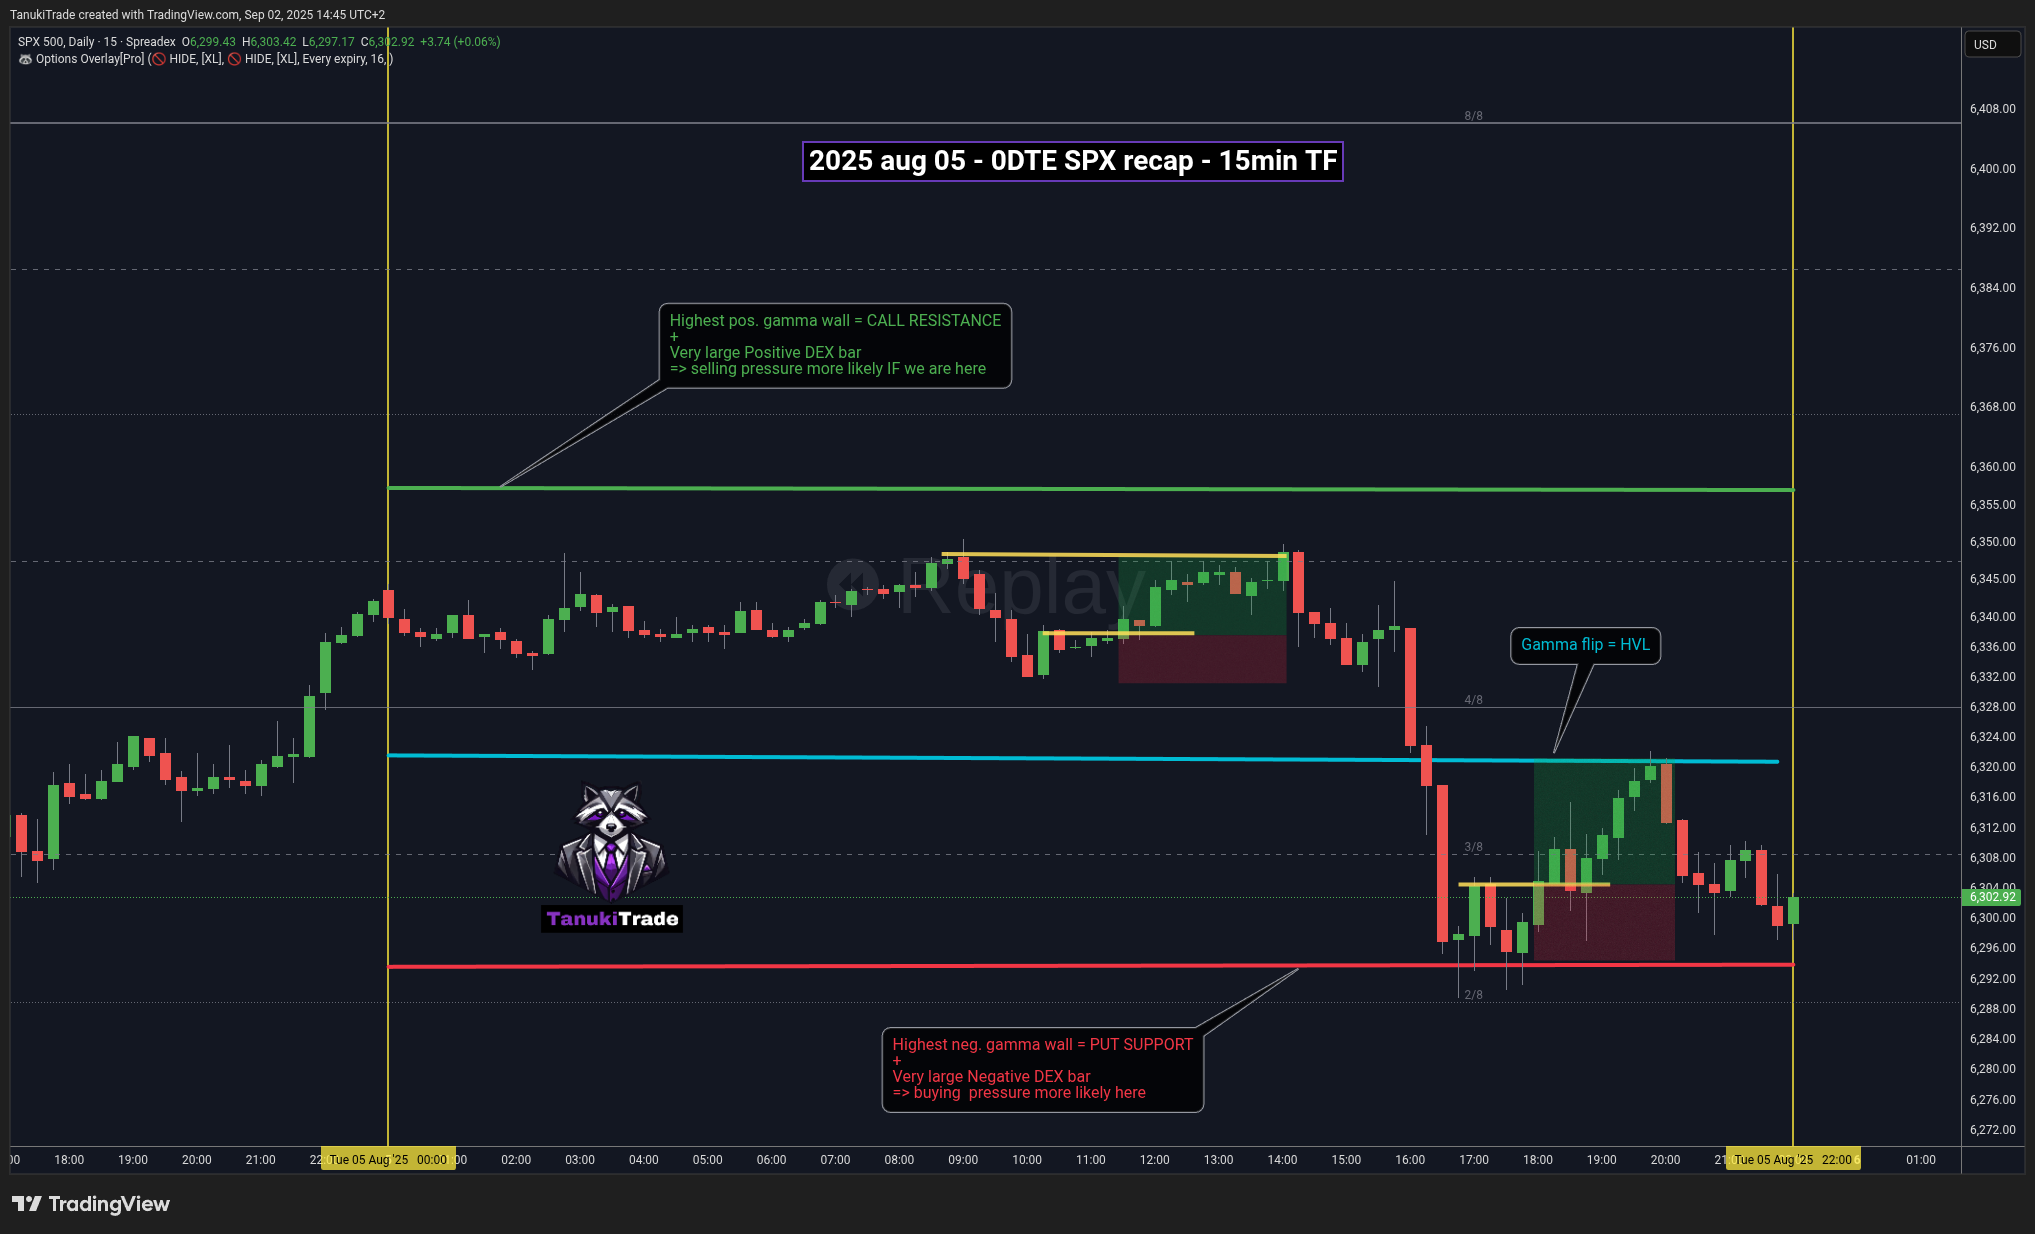
Right after the 9:30 open, mild bullish momentum appeared → price began breaking slightly upward out of sideways action (even clearer on smaller timeframes).
Logical targets: the previous swing high, or a major gamma wall just below CR → exit and take profit.
Yes, you could trade the downside move (if you’re adventurous). Notice how price briefly accelerated near HVL, picking up steam until reaching put support. But this is not the primary setup we’re looking for.
The higher-probability trade was the rebound: thanks to a very strong DEX+GEX+NetOI strike cluster, and the fact we were in a positive GEX regime all day.
After the rebound, momentum resumed to the upside → once again a bullish run toward HVL. Exit, take profit, and step aside.
🎥 For those who want to dive deeper, here’s the 1/b Recap Video:
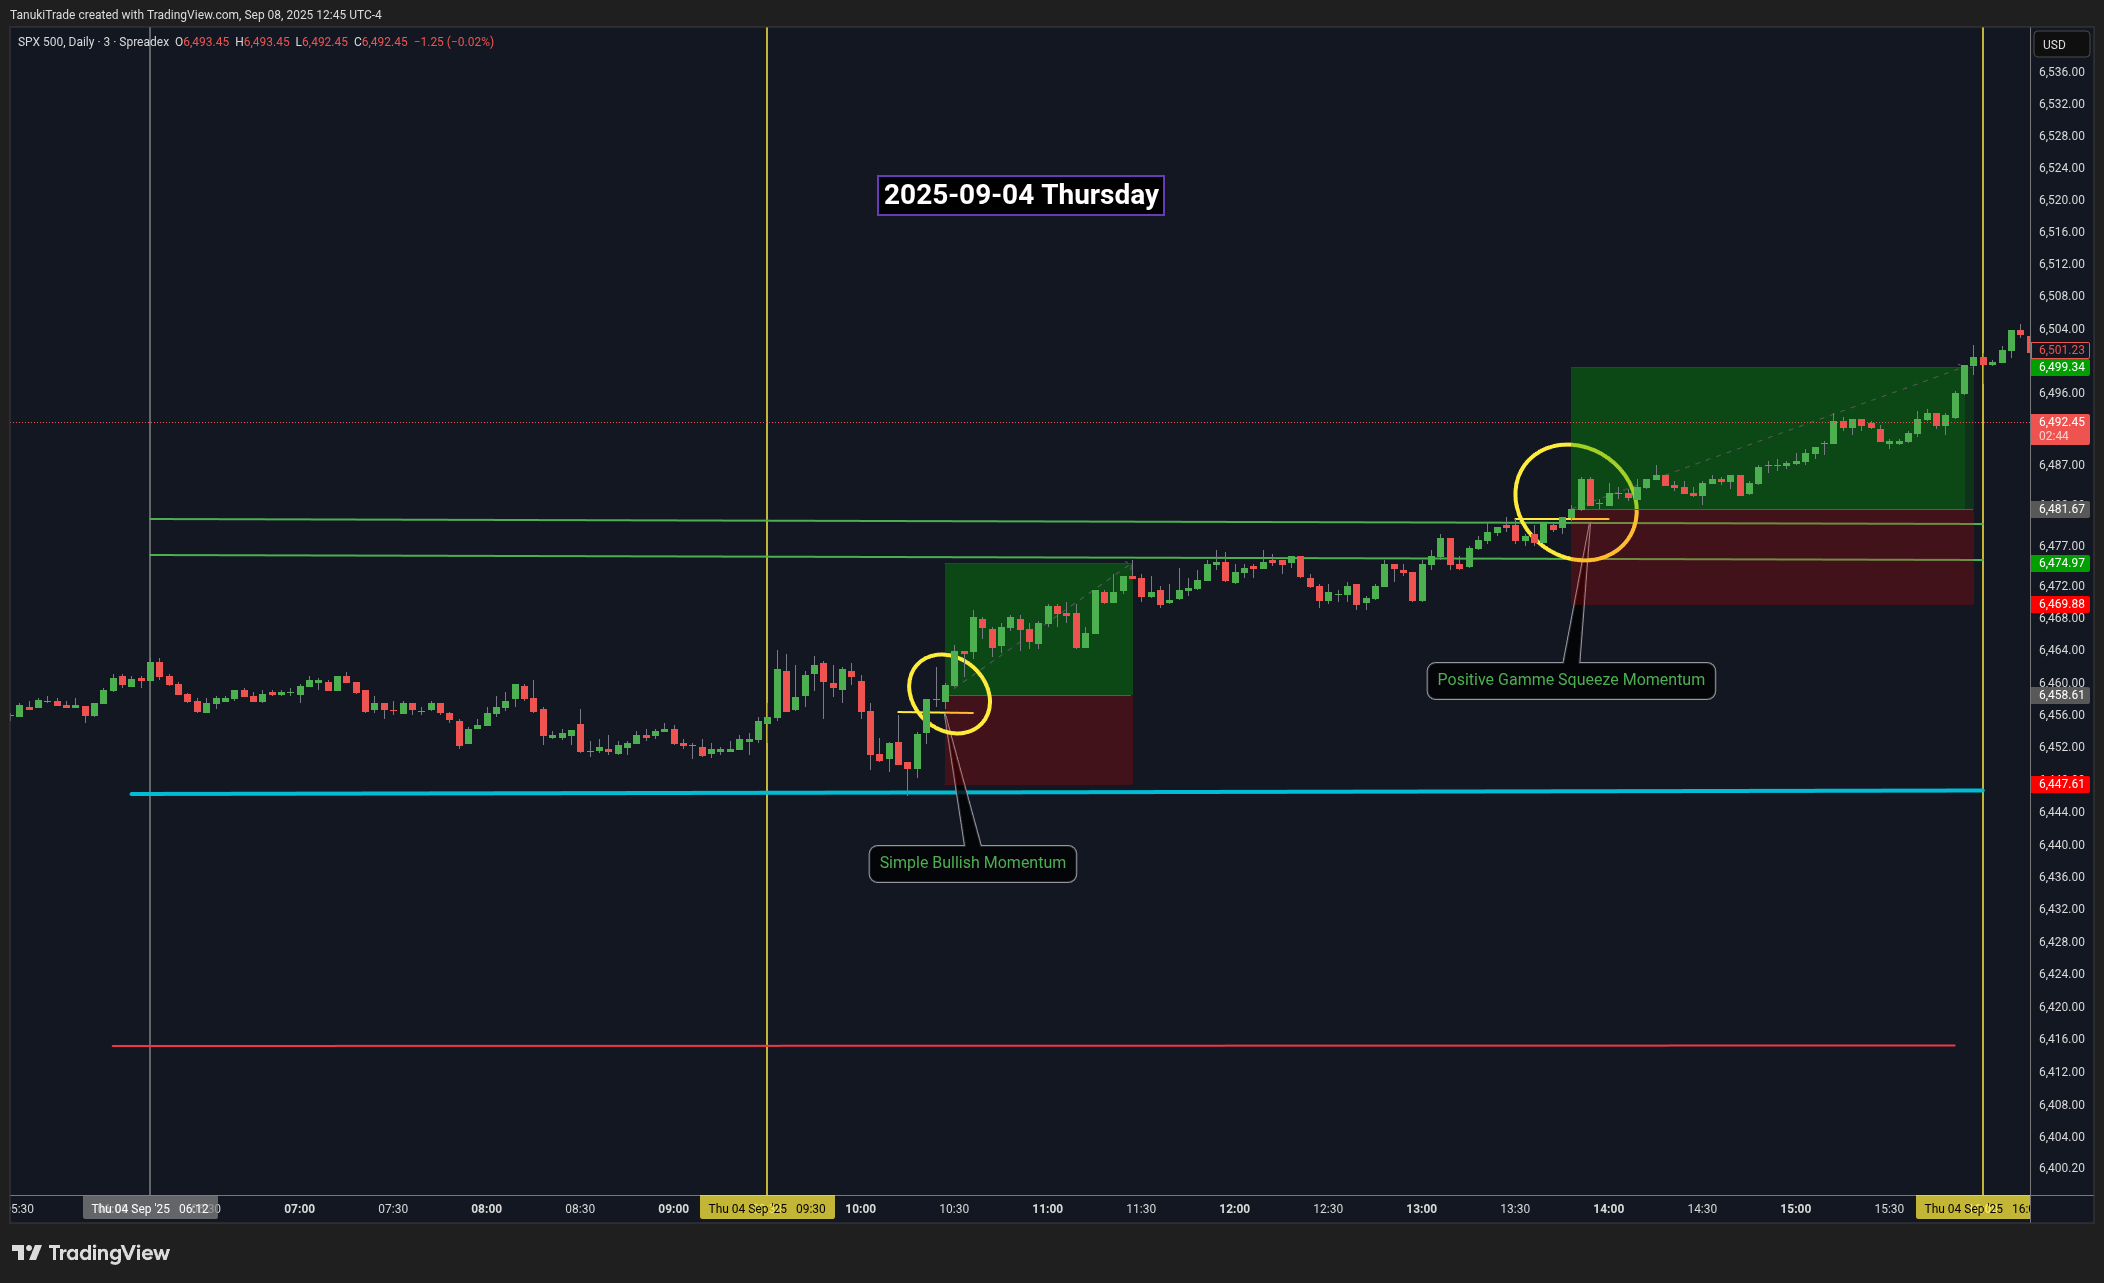
📅 Example 1/C – Positive Gamma Squeeze
(Thursday, Sept 4, 2025)
The previous examples showed how, with a clean GEX distribution and well-defined levels, we can often identify what’s most likely to happen during the session.
But remember—this is all about probabilities. The market won’t always behave the way we expect. Rarely, but importantly, we can face situations where things don’t play out as modeled. We don’t have a crystal ball to predict every outcome under every condition.
That’s the real edge of GEX: we don’t need a crystal ball.
We watch GEX + DEX, and—most importantly—we wait for momentum before acting. That’s why I always say: never short blindly at call resistance—always wait for confirmation.
The levels marked by our indicator are reaction zones. We can form strong expectations for how price might react, but we’ll never know with 100% certainty ahead of time.
And you know what happens if everyone at call resistance positions for a bearish rejection … and it doesn’t come?
👉 That’s right: short squeeze.
Or in GEX language: a positive gamma squeeze - 3-min TradingView chart (1/C):
🔎 What is a Positive Gamma Squeeze?
If the market is strongly bullish—whether because of news or just sentiment—then despite hedging flows, buyers keep pushing.
Once spot pushes through call resistance with momentum, market makers are forced to follow retail in the same direction. To hedge their positive gamma exposure, eg. they buy underlying shares.
📌 How this manifests:
Price behaves as if under a negative GEX regime—but upward.
Sharp moves
No damping effect from dealers
Momentum builds instead of being absorbed
📊 Premarket Outlook for 1/C
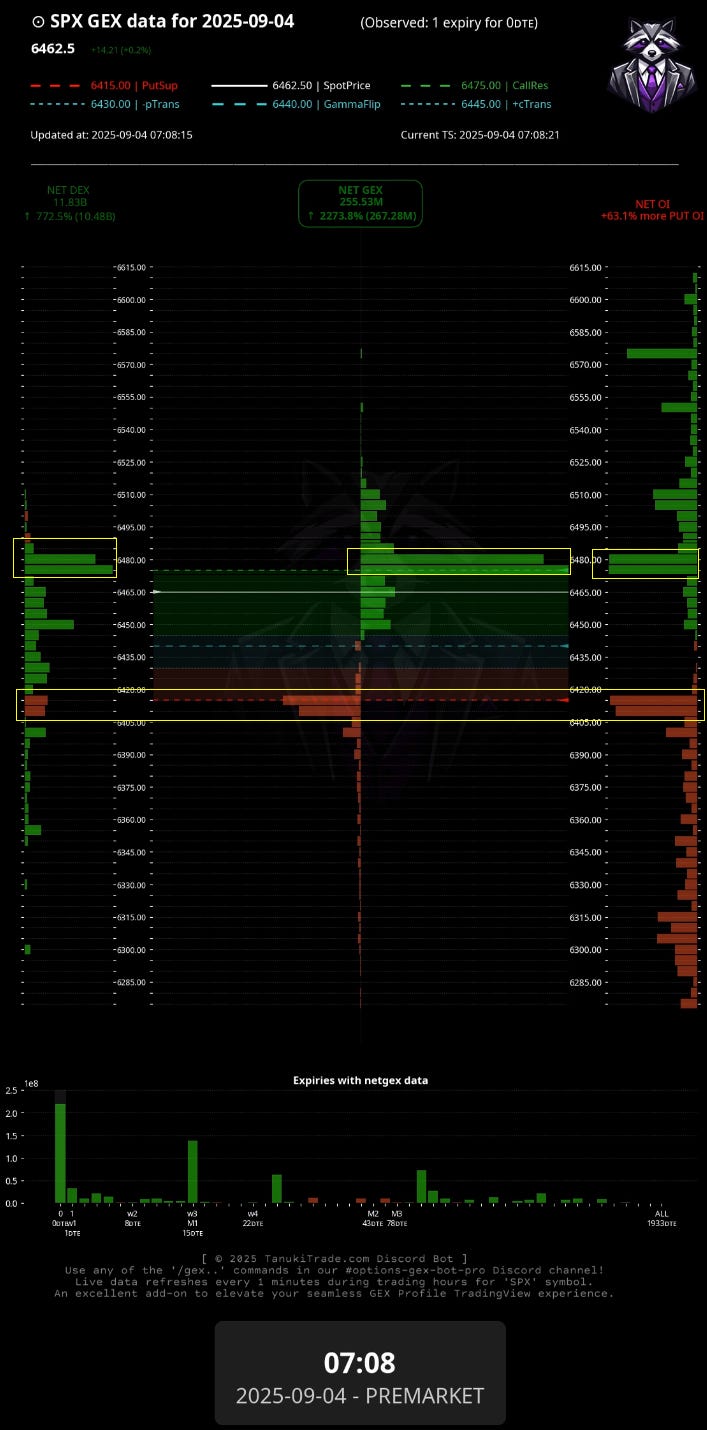
At first glance, everything looked like a perfect fit for our (1) textbook pattern.
But intraday, the less probable scenario unfolded.
At 13:55, the GEX+DEX visualization around call resistance looked like this:
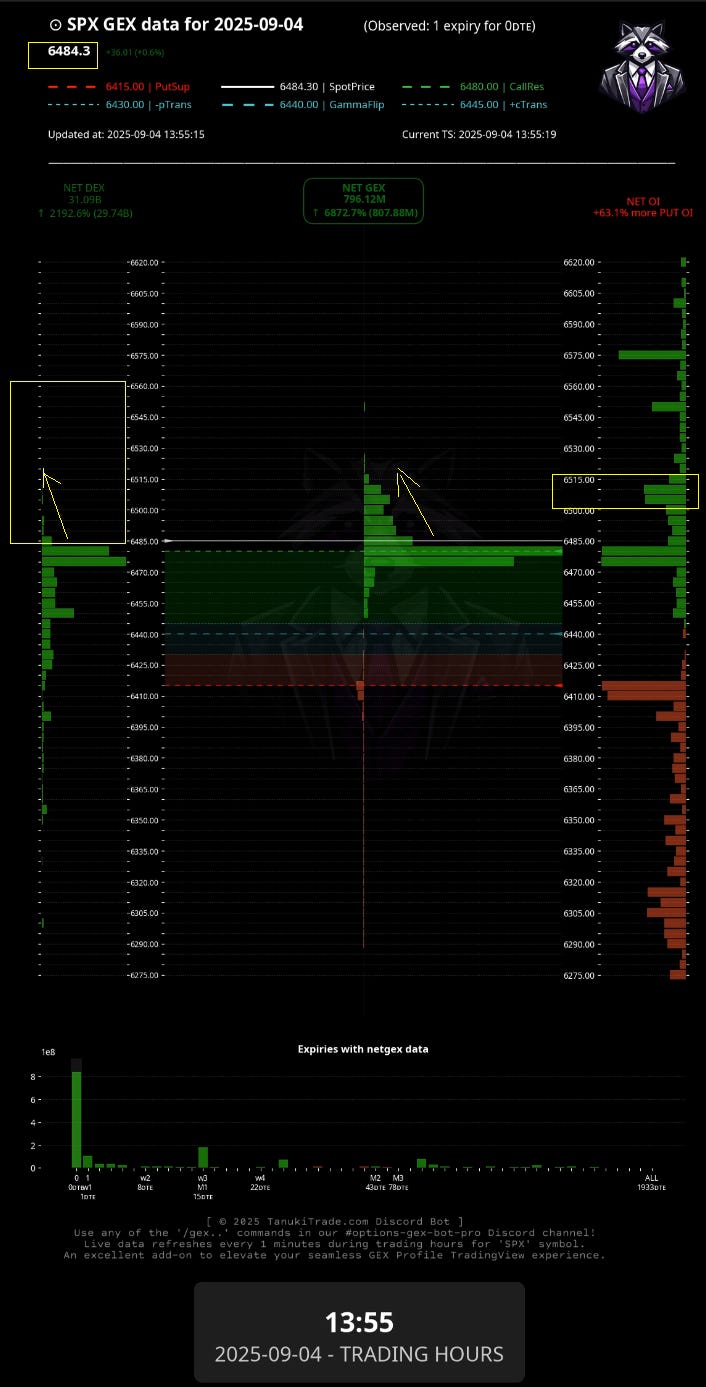
What we see:
Above
CR, there weren’t really any strikes significant enough (from the dealer’s perspective) to meaningfully alter NetDEX.This meant dealers could easily hedge their declining positive delta exposure simply by going long.
So when the market wanted to buy, dealers bought too. They effectively joined the retail side, and their usual counter-flow disappeared.
Trading implications:
An easy long entry target was the next significant NetOI cluster.
Notice on the (1/c) TradingView chart above: price didn’t reject strongly from CR as in examples 1/a and 1/b.
Instead, it clung to CR, grinding upward slowly until it broke through the 6480 level.
Only then did bullish momentum accelerate.
🎥 For those who want a full breakdown, here’s the 1/c Recap Video:
https://discord.com/channels/1339175019640520765/1412400753410048051/1413258491719848028
That’s all we had space for this week’s letter.
I hope you enjoyed the content! If you did, and haven’t yet, please consider leaving us a quick rating on Trustindex—it means a lot. 🙏
👀 Coming Next Week
In the next newsletter we’ll dive into:
Permabull and Permabear GEX patterns
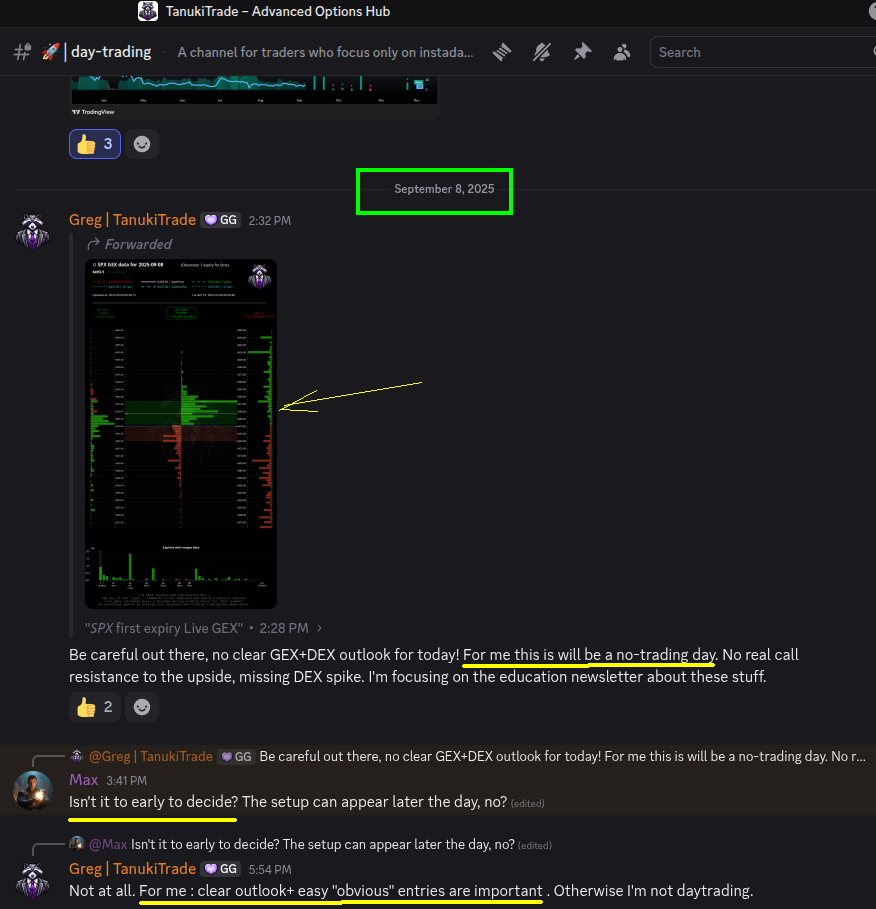
Why I said in Discord during premarket today that with this kind of GEX outlook, it was a “no-trading day” for me:
I spent some time studying your newsletter this Saturday morning and also reviewing Part 1. Thank you always for these excellent newsletters.
i really like the way you combied the DEX and GEX. Can you talk more about bullish momentum?