


02/03 Weekly Trading Outlook: SPX, AAPL, TSLA + Earnings List
Premarket GEX Updates Are Here! Plus, SPX, AAPL, TSLA Analysis & Earnings Watch. Market Shifts, New GEX Updates & This Week’s Must-Watch Earnings Reports

This week, we’ve started updating our options indicators before the market opens.
This has been a long-standing request from users—especially 0DTE traders, who will likely benefit the most.
Update schedule (Wall Street time):
✅ 1st update: 5:40-6:50 AM (NEW! PREMARKET UPDATE)
✅ 2nd update: 9:40-9:50 AM – First regular trading hour
✅ 3rd update: 12:40-12:50 PM
✅ 4th update: 2:40-2:50 PM
✅ 5th update: 3:40-3:50 PM – Before close
This effectively covers the entire trading day, and we expect it to resolve the frustrating issue where TradingView sometimes fails to process our first data packet after the market opens, leading to a 1-2 hour gap in live data.
Why This Matters for Traders
The most critical update is either the premarket update or, if that fails, the first post-market open update.
As long as one of these comes through, you can trust that you are seeing relevant GEX levels throughout the session!
No Need to Worry About Missed Intraday Updates
🔹 90% of GEX data providers (e.g., UnusualWhales, MenthorQ, and other secondary sources) only update data once before the market opens—if at all!
🔹 Our 5 daily updates (or at worst 4, if one is missed due to TradingView’s tech side) ensure that GEX levels remain actionable throughout the day, even for 0DTE trading.
This means you can trade confidently, knowing that the most important liquidity and positioning data is always up to date! 🚀
Market Outlook: Let's Dive In with the Latest Transition BOX Coloring & GEX Levels!
We’re utilizing our newest Transition BOX color coding alongside the GEX indicator for this week’s analysis.
If you’re new to the updated color scheme, here’s a cheat sheet for reference: https://www.tradingview.com/x/krUADfRP/
SPX – Weekly Outlook
SPX shifted into a strong sideways trend after recent market whipsaws, but premarket today saw a sharp sell-off.
Now, let’s break down the GEX levels set for Friday’s weekly expiration (first weekly expiry). These are already reflected in today’s GEX data—check them on your indicator!

Key GEX Levels for SPX
📍 Highest Positive Call Wall (Call Resistance): 6075
Acted as resistance last Friday, as it often does initially.
📍 Sideways Zone: 6000-6070 (Transition Zone with GAMMA flip)
Wide Transition Zone → Expect high volatility or slow drifting within this range.
Easy flow between positive and negative GEX profiles, meaning potential sharp moves in either direction.
📍 Put Support (Sum 4DTE): 5900
Very deep support—market is clearly pricing in fear of a potential drop.
Below 6000, there are only negative NetGEX strikes down to 5900, which signals a lack of strong support until that level.
What This Means for the Week
📊 SPX opened in negative GEX territory—if buyers don’t reclaim this zone, we are in for a highly volatile week, potentially with a spiking VIX.
🚫 No reason for bullish optimism unless we break above 6070—until then, expect uncertainty and potential downside pressure.
AAPL – Post-Earnings Outlook
While iPhone sales faced some challenges, Apple’s diversified revenue streams and high-margin services business continue to showcase the company’s resilience. The stock initially reacted positively after earnings, but the broader market disagreed during open hours, leading to a sell-off on Friday.

Now, let’s analyze the GEX chart together. For AAPL 0.00%↑ , I’ve chosen the Optimal Monthly Expiration (March 21), as multiple high gamma exposure expirations align with this date. Since we trade stocks and ETFs over a broader timeframe, rather than day trading, this is the most relevant perspective.
Key GEX Levels & Market Implications
📌 Uncertainty Below 250
Friday’s sell-off and today’s premarket action have weakened the outlook.
AAPL is currently in the 230-232.5 Transition Zone, meaning price action can shift quickly in either direction.
📌 Break Below 230?
A move below 230 would open the door to 220.
📌 Put Support at 220
Implied volatility (IV) remains high, making this an attractive setup for a potential neutral post-earnings trade.
With a 220-250 range, we remain well inside the OTM 16-delta zone for March expiration, which is ideal for premium selling strategies for high IV.
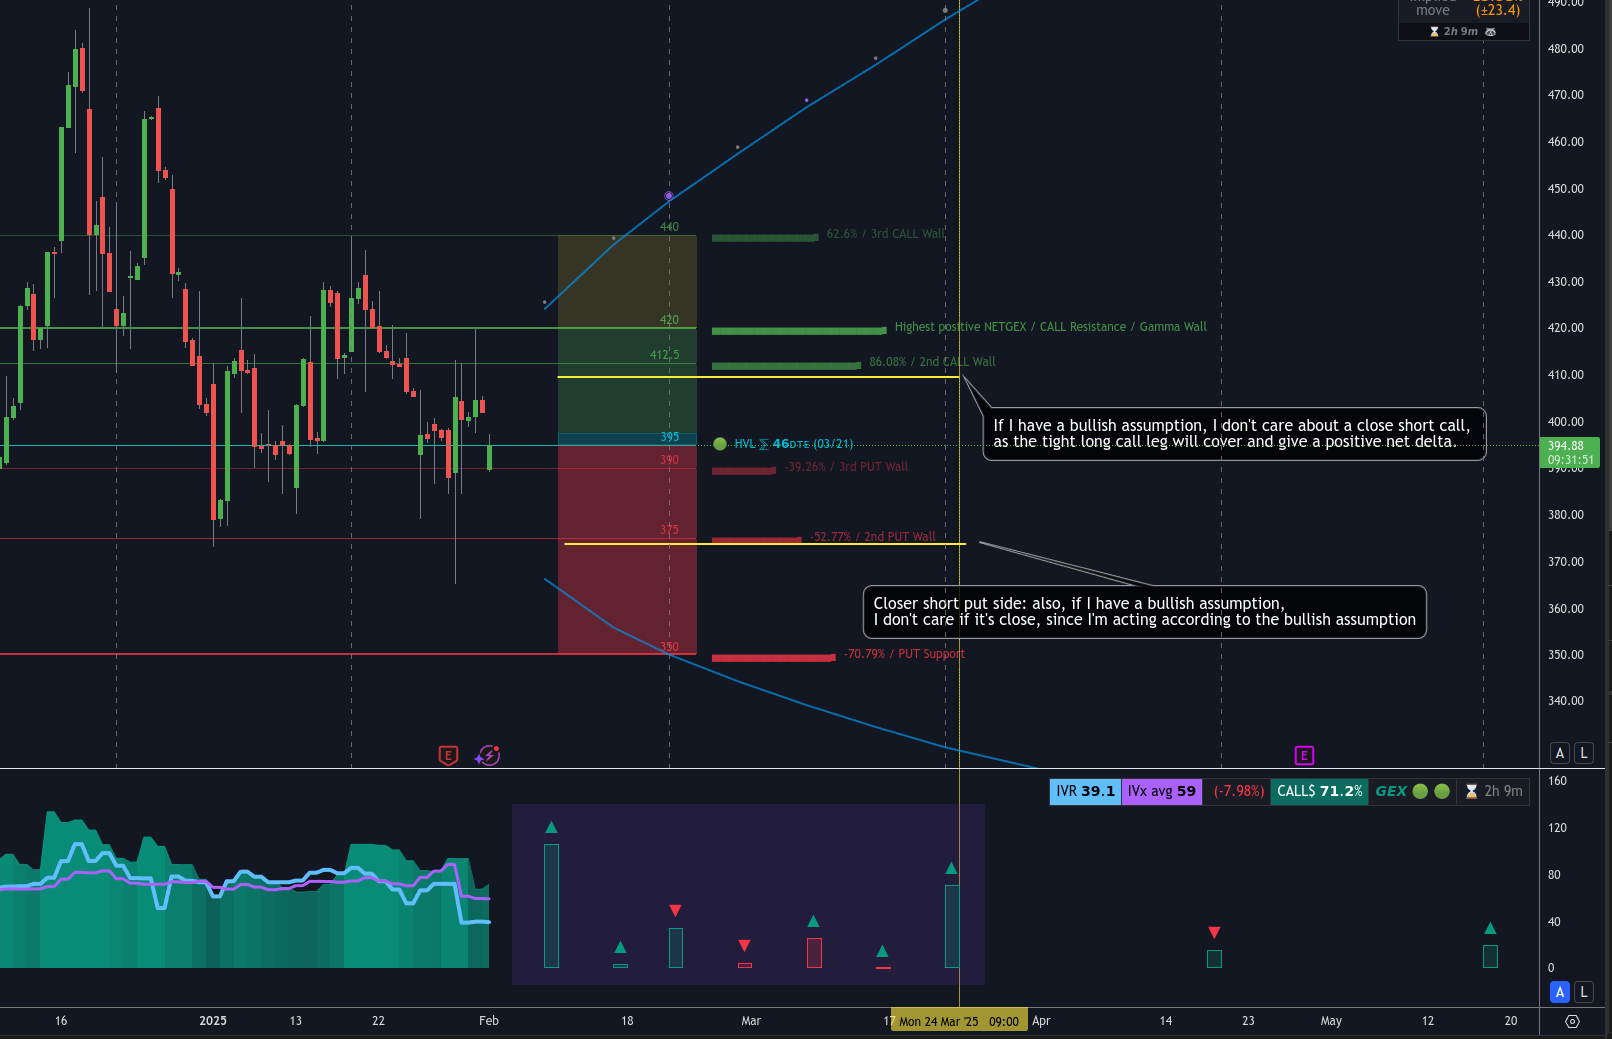
TSLA – Post-Earnings Outlook
TSLA 0.00%↑ ’s sideways transition range remains narrow following earnings.

📌 Key Levels & GEX Insights
Gamma Flip Zone: ~395 (until March expiration)
Tight Transition Zone, Wide Clear Movement Range
Above 420 Call Resistance: Every strike has positive Net GEX, meaning a return to this range would likely support further balanced upside or sideways movement.
Below 390: The next PUT support is at 350, so a break below this level could open the door for a deeper drop.
TSLA Strategy Consideration: Capitalizing on Call Skew
There is a strong call pricing skew across expirations… March calls are priced 71% higher than puts at the same distance (per expiry table).
This presents an opportunity for a low-POP Iron Condor (IC) where the max profit is higher than max loss.
🔹 Key rule: When call pricing skew exists, single-leg call options become expensive, but call vertical spreads remain relatively cheaper for the same strike distance.
In case of Bullish-Tilted IC Setup
A slightly bullish IC could be a reasonable approach, as it still looks decent even in the case of a strong breakout.
🔗 Example Trade Setup LINK #1
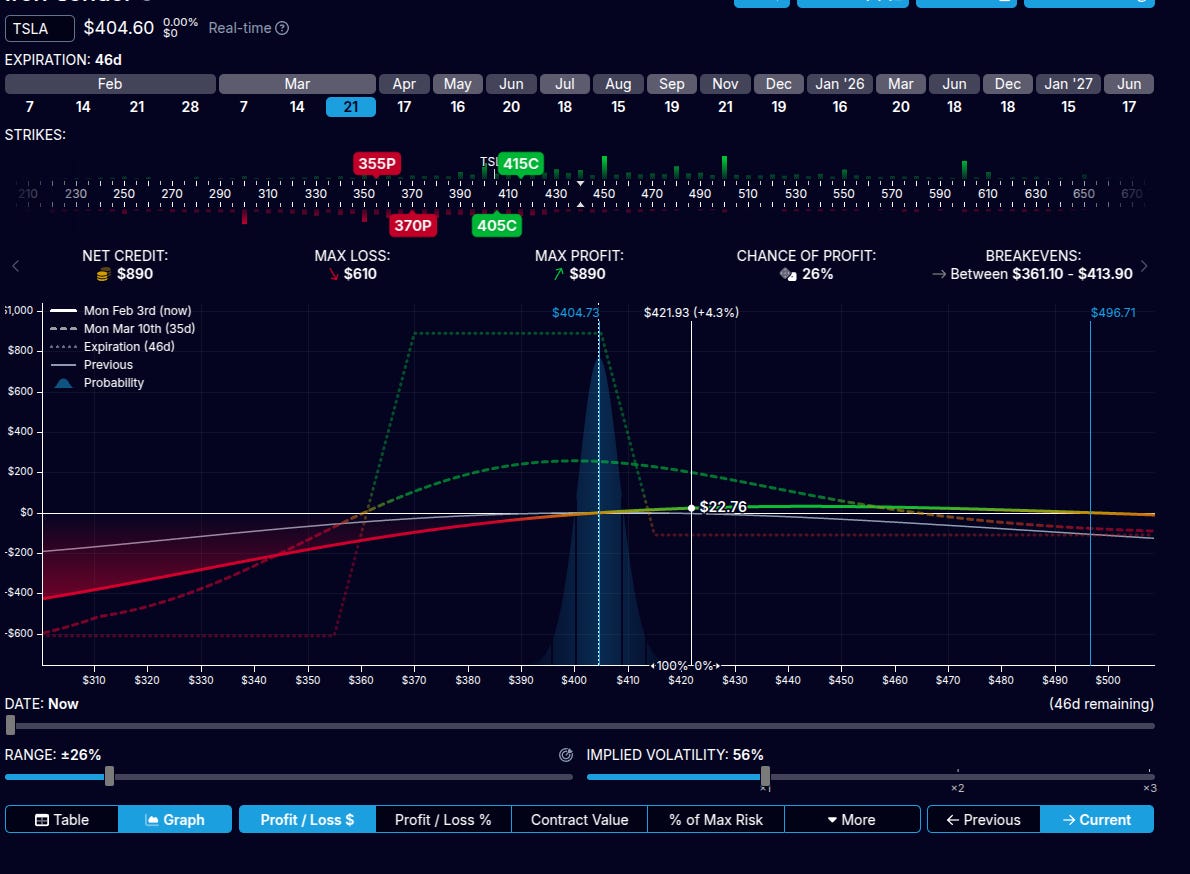
🔹 Short Put Leg Placement: Below the 2nd Put Support (375)
🔹 Net Delta: 1.8 → Not excessive, but leans bullish
🔹 If bearish instead: The same concept can be applied in reverse for a bearish IC.
Neutral Outlook? Here’s another Great Setup!
For a neutral market expectation, this Iron Condor setup could be an excellent choice:
🔗 Neutral IC Example LINK2
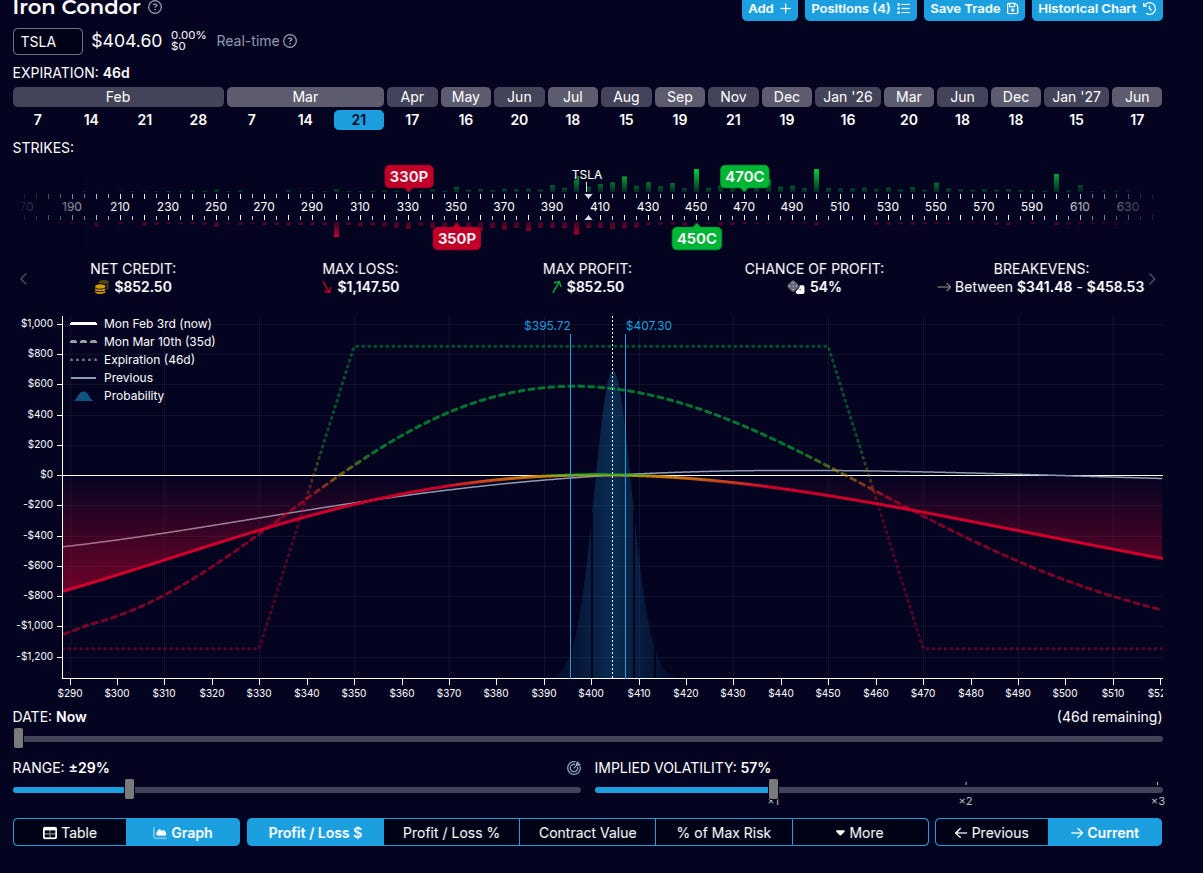
This structure allows for balanced risk-reward while capitalizing on the elevated IV and strong call skew.
📍 Key Features:
Short Put Leg at 350 (right at the PUT support)
Short Call Leg at 450 (above the potential yellow call squeeze territory )
Low directional bias but still captures premium effectively.
Adapting Based on GEX Shifts
This positions are not static—you can adjust dynamically if the market moves!
🔄 How to Adjust if the Market Turns?
If TSLA rallies hard, roll up the short put side to reduce upside risk while maintaining premium collection.
If TSLA breaks down, roll down the short call side to make the call spread larger or convert it into a more bearish structure.
With GEX as a guide, you can modify your position strategically rather than reacting emotionally.
📍 Avoid Over-Managing
Don’t adjust daily—allow theta decay to work.
I typically adjust net delta only once per week, unless market conditions force an earlier move.
📍 Adjustment Thresholds
I never let a short leg go inside ~14-delta, as adjustments would then become significantly more expensive, especially for the farther buy leg.
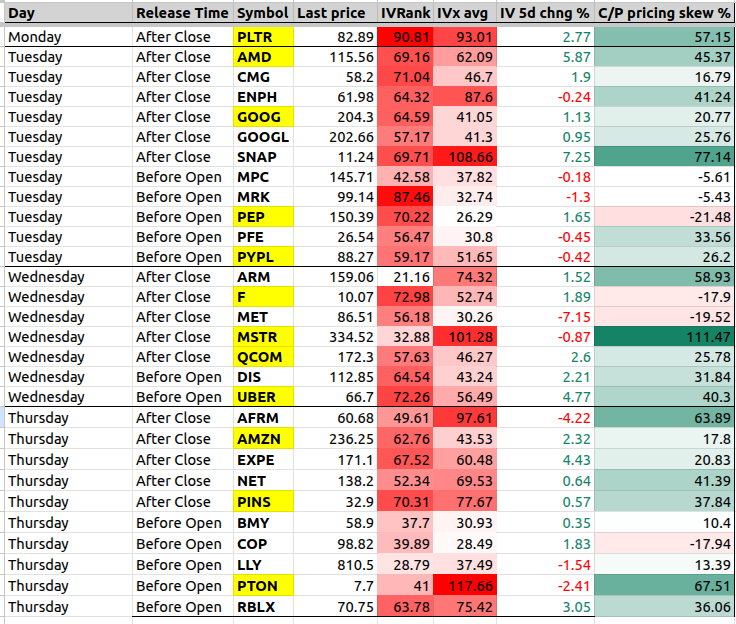
👉 UPCOMING WEEKLY EARNINGS LIST
Below are the upcoming earnings report dates for the week. Please note that I prepared this list on weekend, so the numbers may have shifted slightly since then.
I’ll admit it—the VIX spike shook up my post-earnings trades a bit.
Since I opened them before Trump's inauguration, the IV meltdown hasn’t fully played out in my favor yet.
But hey, theta is a relentless warrior—it will grind its way through, and profits will come with patience. 💪
👉 Oneclick-save TradingView Watchlist is here
👉 or Google Sheet is here
I’ll pay special attention to the symbols highlighted in yellow:
PLTR 0.00%↑ , AMD 0.00%↑ GOOG 0.00%↑ PEP 0.00%↑ PYPL 0.00%↑ F 0.00%↑ MSTR 0.00%↑ F 0.00%↑ AMZN 0.00%↑ UBER 0.00%↑ QCOM 0.00%↑ PINS 0.00%↑ PTON 0.00%↑