
03/16 Gamma Classification Engine + Weekly Outlook
Watch For Oil Contango

Befor all… today we pushed a new update to the TanukiTrade webapp.
This one is technically a minor release, but under the hood quite a lot changed.
The main goal was to simplify the interface and unify how the GEX structure is calculated and displayed across the platform.
Two main things landed in this version:
a new compact layout for faster navigation
the new Gamma Classification Engine, which now drives all key levels and zone logic across the app
You’ll also notice a number of smaller improvements around chart controls, level visualization, filtering, and level analysis.
Below is a quick walkthrough of the main changes.
1) Gamma Classification Coloring
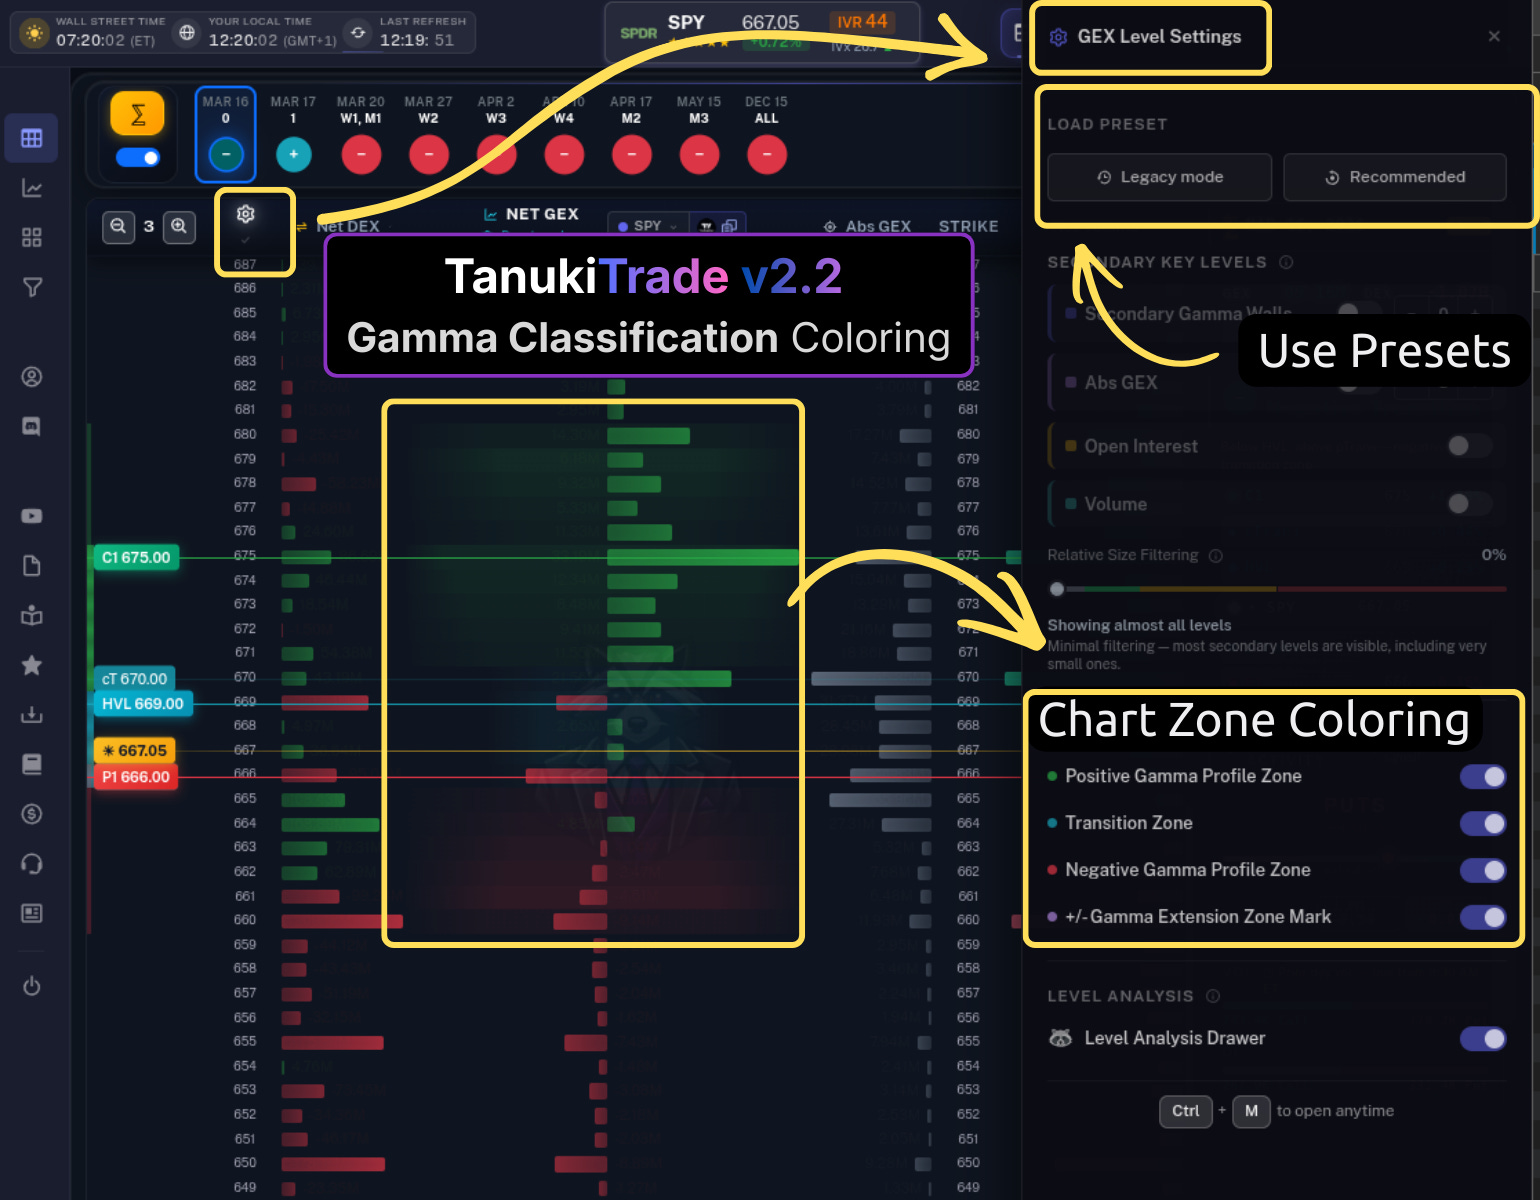
One of the first things you’ll notice is the new gamma classification zone coloring.
Instead of just seeing individual levels, the chart can now visually separate the positive gamma, transition, and negative gamma zones directly on the structure.
You can also quickly switch between presets depending on how much detail you want to see.
The goal here was simple:
make the overall gamma regime readable at a glance.
2) Secondary Key Levels
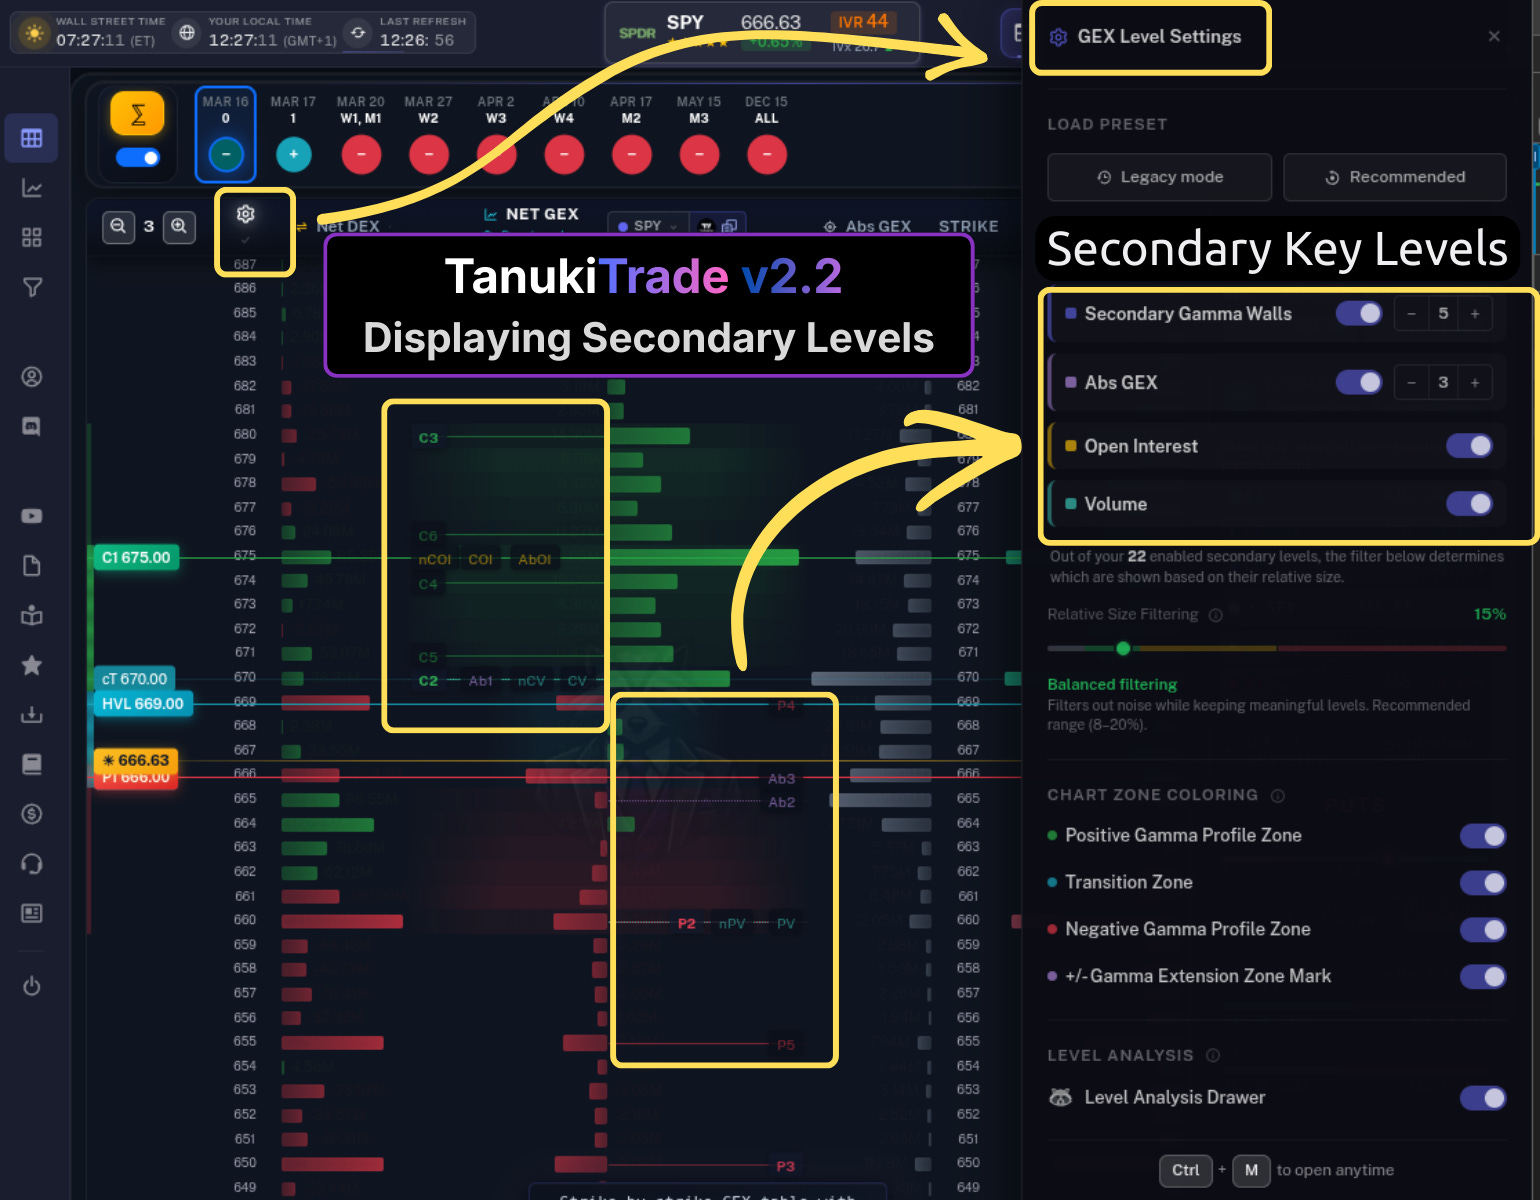
The platform can now display secondary structural levels in addition to the main gamma walls.
These include additional gamma concentrations, absolute GEX levels, open interest clusters, and volume-based strikes.
You can control how many of these levels appear using a relative size filter, so you can either keep the view minimal or explore the deeper structure of the options chain.
This gives you much more context without overwhelming the chart.
3) Gamma Classification Engine
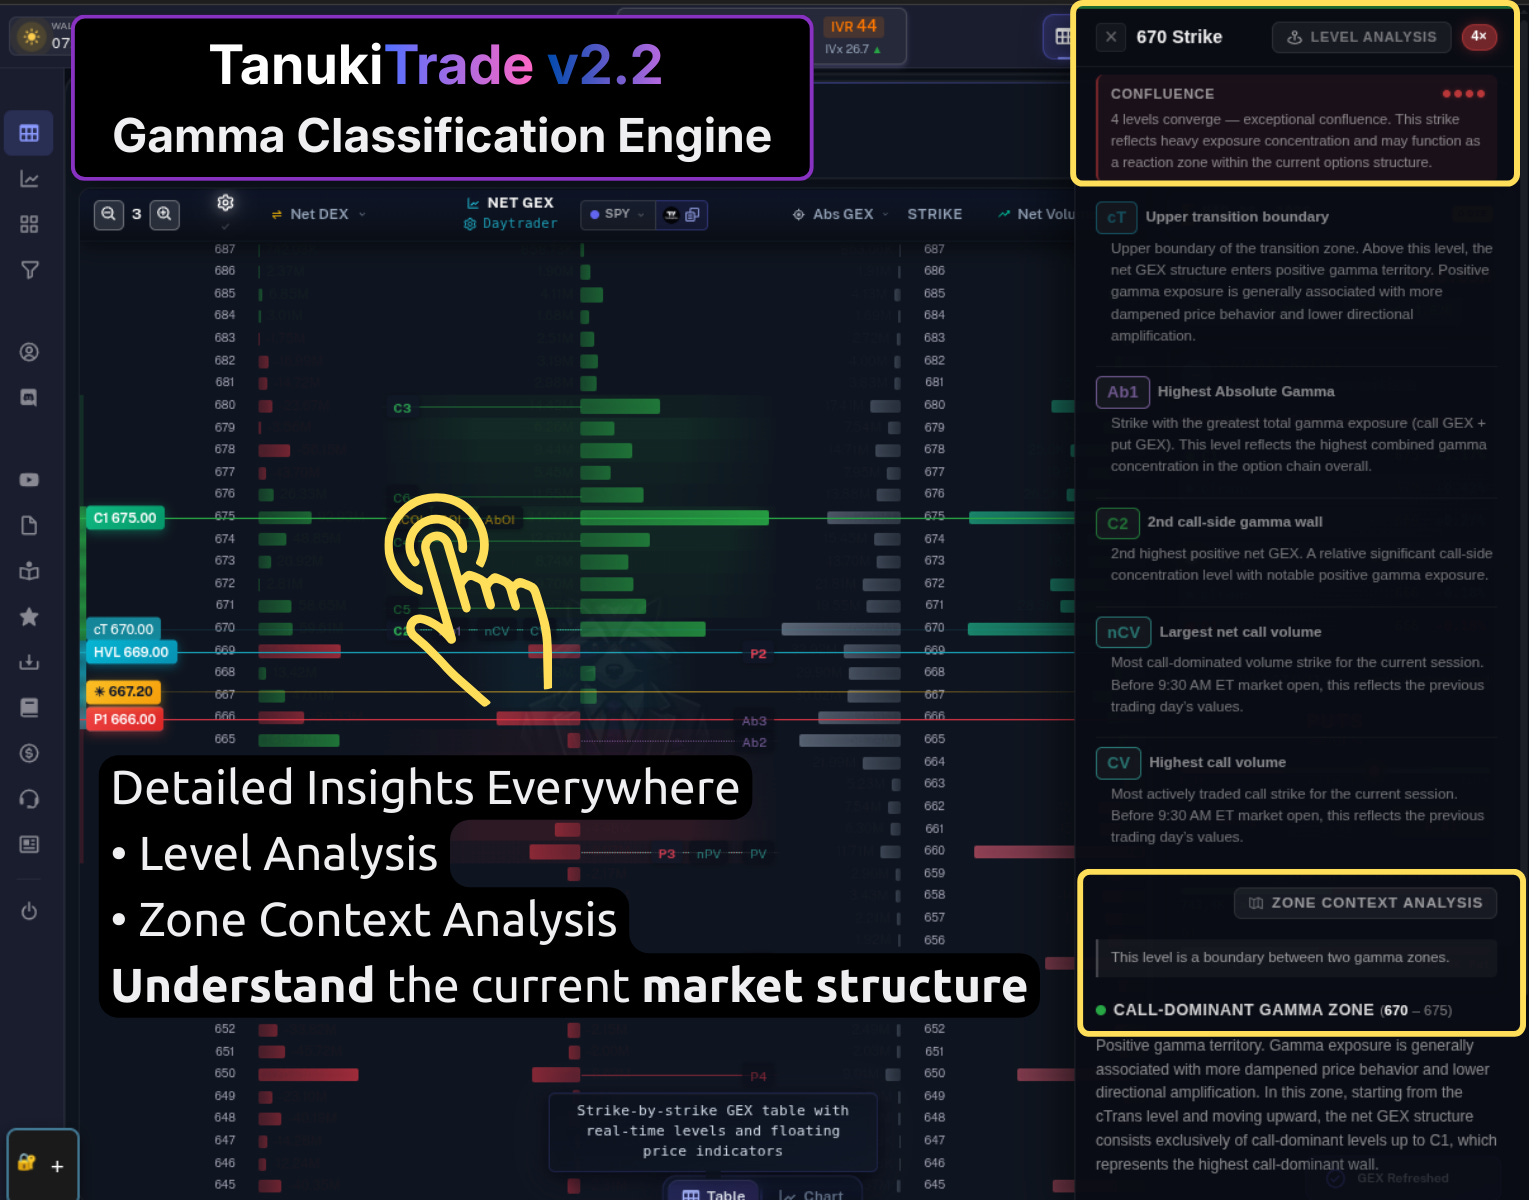
Under the hood, all of this is now powered by the new Gamma Classification Engine.
This engine is responsible for identifying and classifying key levels across the options structure, including things like:
HVL
call-side and put-side gamma walls
transition levels
volume and open interest concentrations
Because this system now drives the entire platform, the same structure is interpreted consistently across the different views.
Another major addition is the Level Analysis panel.
You can now click on a level and immediately see detailed information about what that level represents and why it matters.
This includes the classification of the level, any structural confluence, and the broader gamma zone context it belongs to.
Instead of just seeing a label on the chart, you now get the full structural explanation behind it.
4) GEX Chart View Fine-Tuning
The chart view itself also received a number of improvements.
You can now fine-tune how many levels are displayed, how aggressively smaller levels are filtered out, and which structural elements appear on the chart.
This makes it much easier to remove noise and focus only on the levels that actually matter.
In other words: you only see what truly matters.
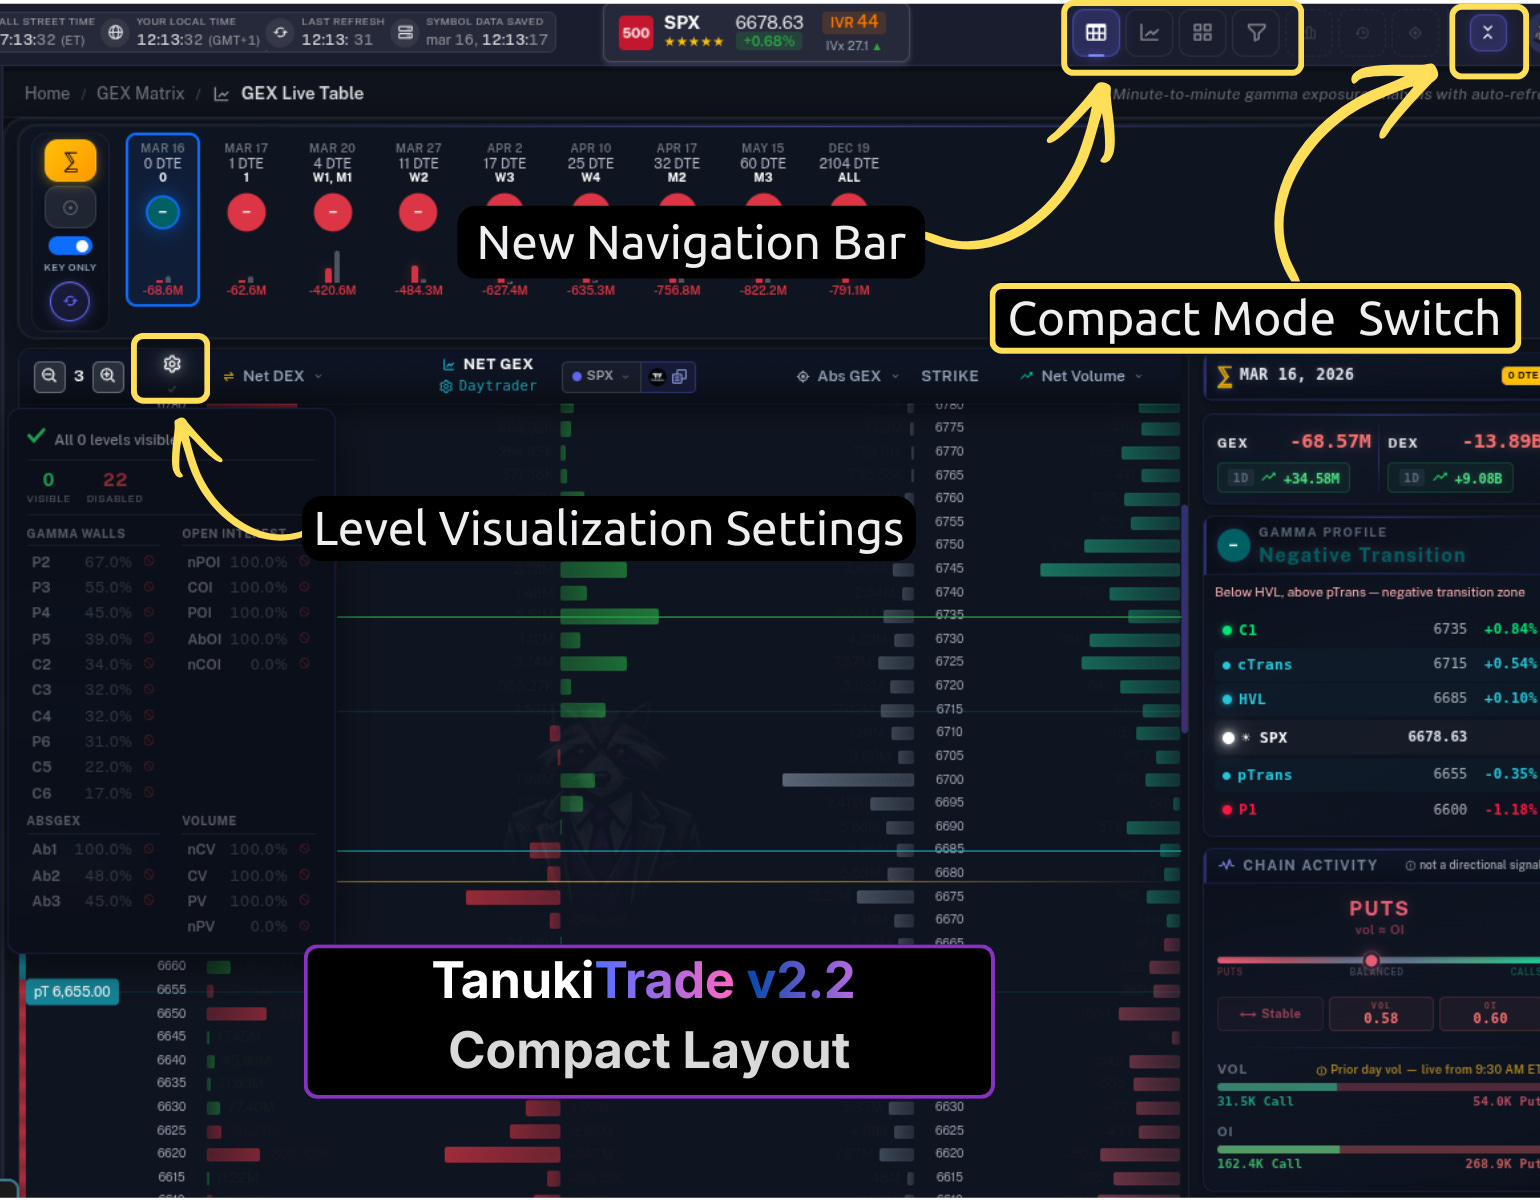
5) New Compact Layout

Finally, the webapp itself now runs on a new compact layout.
Navigation has been simplified, the interface uses space more efficiently, and key controls like level visualization settings are easier to access.
The idea was to make moving between the main tools — such as GEX Live, the chart, and other analysis views — faster and more intuitive.
Why this matters
The goal with this update was not just to add more features, but to make the options structure easier to understand visually.
Once you start using the new classification engine, zone coloring, and level analysis together, the market structure tends to reveal itself much more clearly.
You may find that after spending some time with these tools, you start looking at the market through a completely different lens.
Take a few minutes to explore the update — it might change the way you read the options landscape.
03/16 MARKET OUTLOOK FOR THE WEEK
The dominant macro driver in markets right now is oil.
Over the past several sessions, the price of crude has become the primary variable shaping risk sentiment across asset classes. Geopolitical tensions surrounding the Strait of Hormuz have raised the possibility of disruptions to global energy supply, and markets are rapidly repricing that risk.
Energy markets react first in these environments, and equities tend to follow.
When oil moves sharply higher, investors begin pricing several second-order effects at the same time:
rising inflation expectations
potential supply shocks
a more cautious Federal Reserve
tighter financial conditions
That combination usually places pressure on equity indices.
Over the last week this relationship has been visible in real time. As oil pushed higher, the S&P 500 weakened, highlighting the negative correlation currently forming between energy prices and equities.
In short, the market is operating inside an energy-driven macro environment.
🔶 SPX — Positioning Structure
From an options positioning perspective, the S&P 500 currently sits between two major gamma zones.
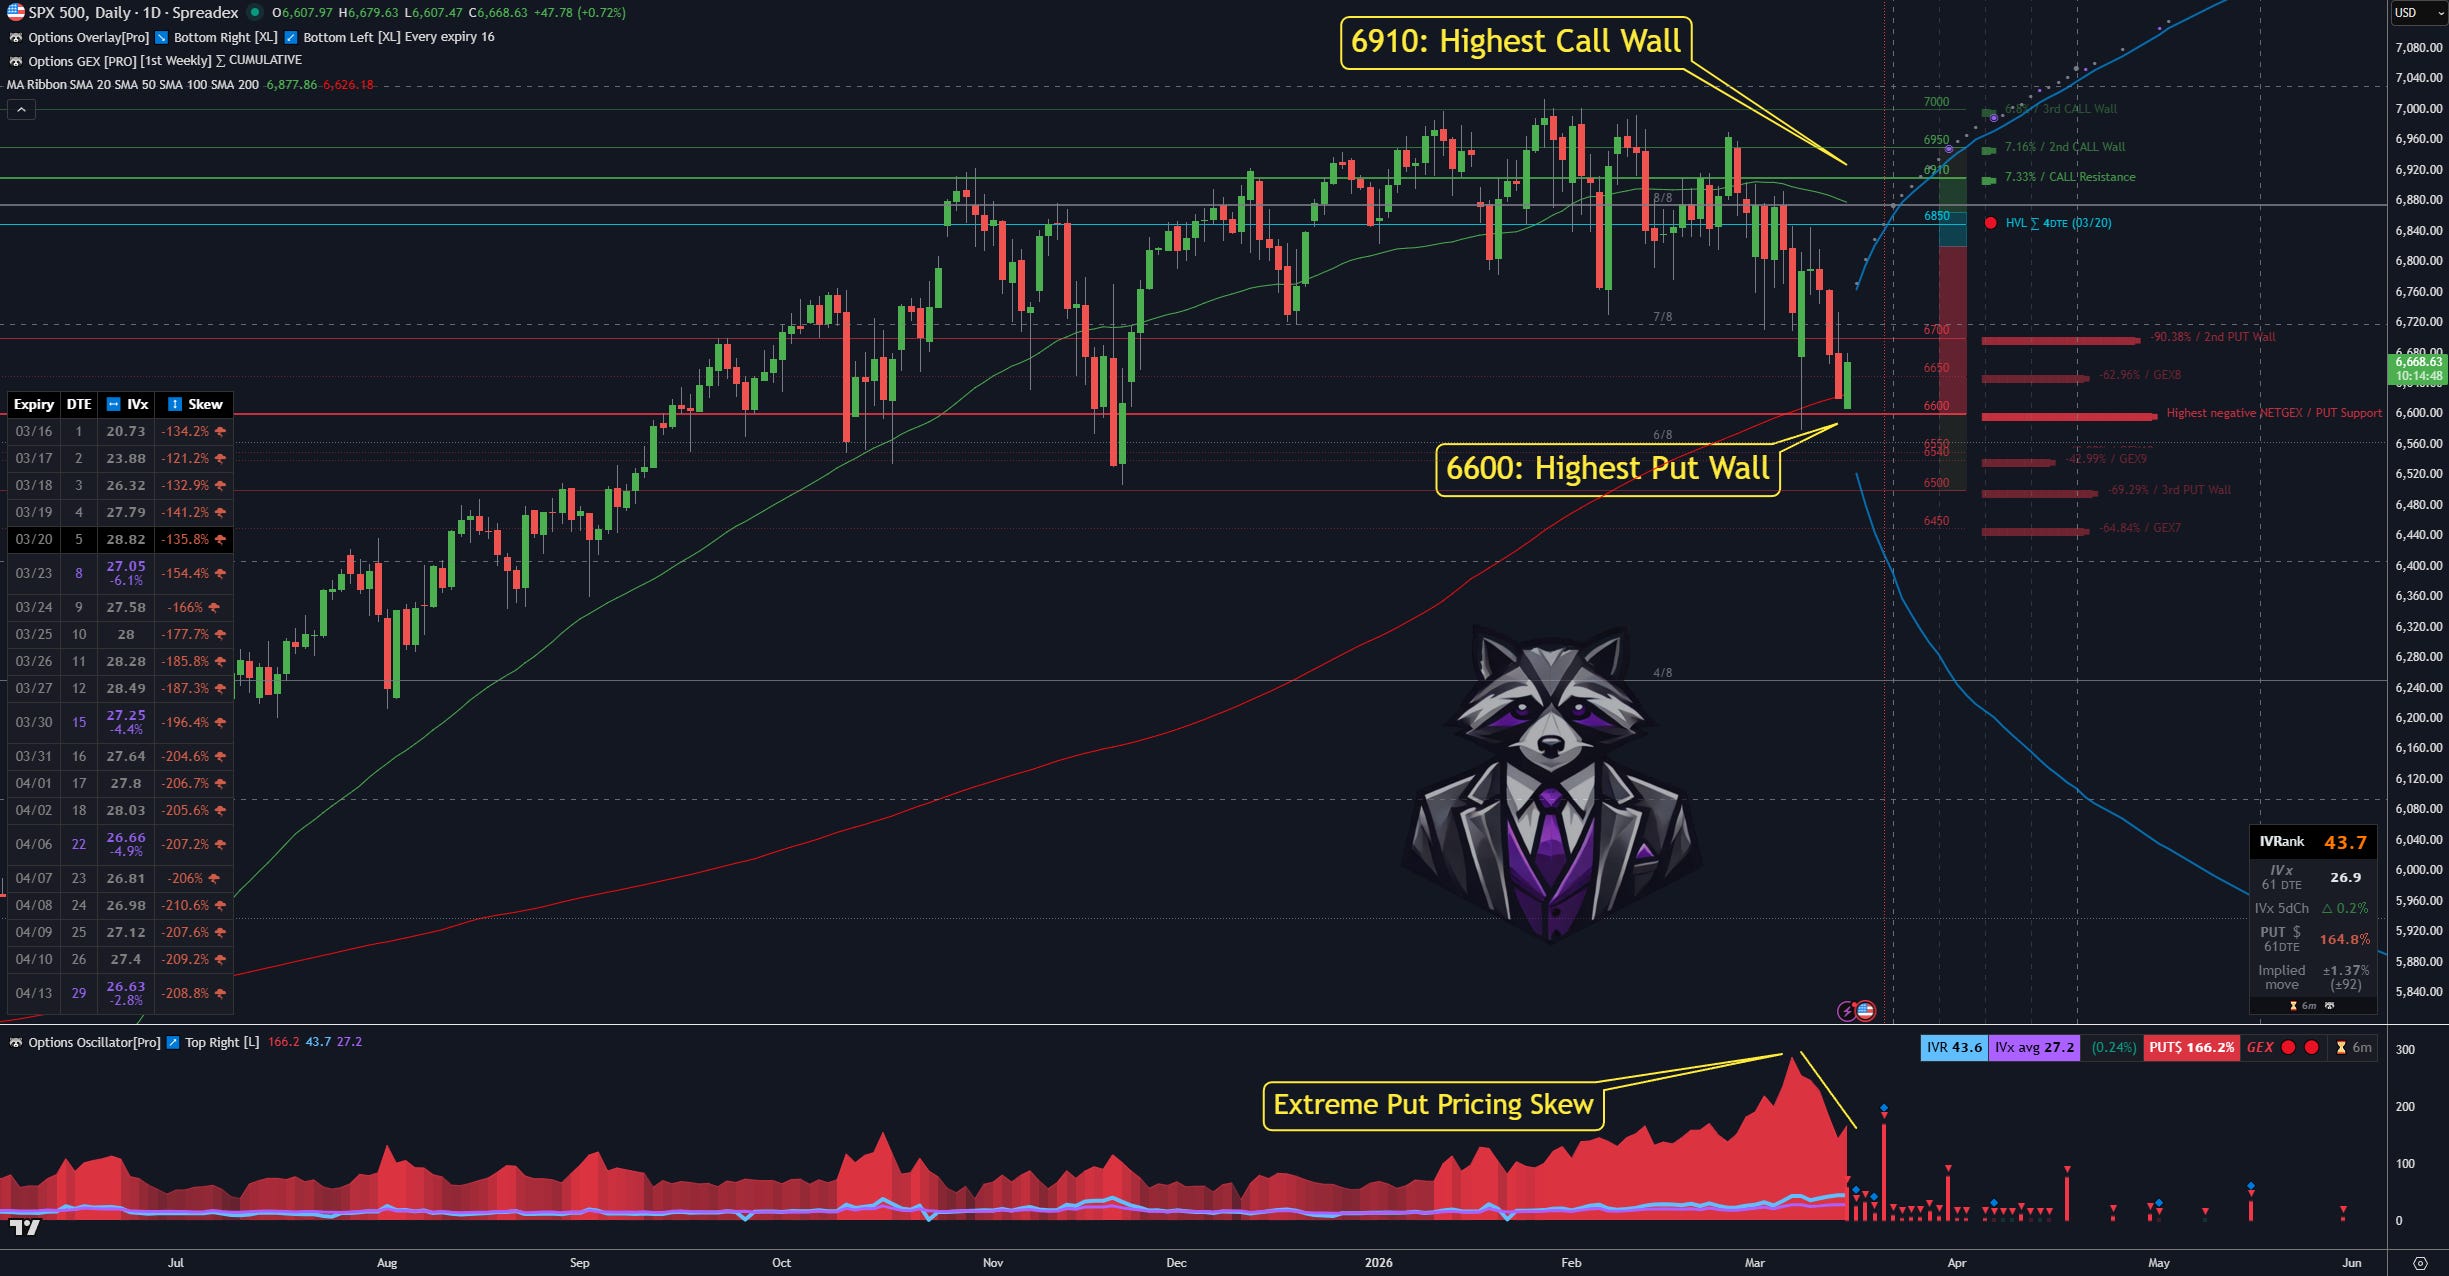
The most important levels right now are:
6600 → strongest put wall
6910 → largest call wall
These levels define the main positioning corridor for the index.
The break of the 6700 level earlier in the week weakened the short-term technical structure. That level had acted as a stabilizing pivot in recent sessions, and its loss allowed selling pressure to accelerate.
Price is now trading closer to the lower end of the positioning range.
The 6600 area represents the largest put concentration, where dealers hold the highest amount of downside gamma exposure.
On the upside, 6950 remains the dominant call wall. Until positioning shifts significantly, that area may represent the strongest resistance cluster in the current structure.
This leaves SPX trading inside a relatively wide positioning corridor where macro headlines can easily drive short-term moves.
Another important development can be seen in the put pricing skew.
During the height of the recent volatility spike, SPX put skew briefly reached extreme levels close to 300%, reflecting intense demand for downside hedging.
Since then the skew has fallen dramatically. Current readings are closer to 150–160%, indicating that a large portion of the panic-driven protection buying has already been unwound.
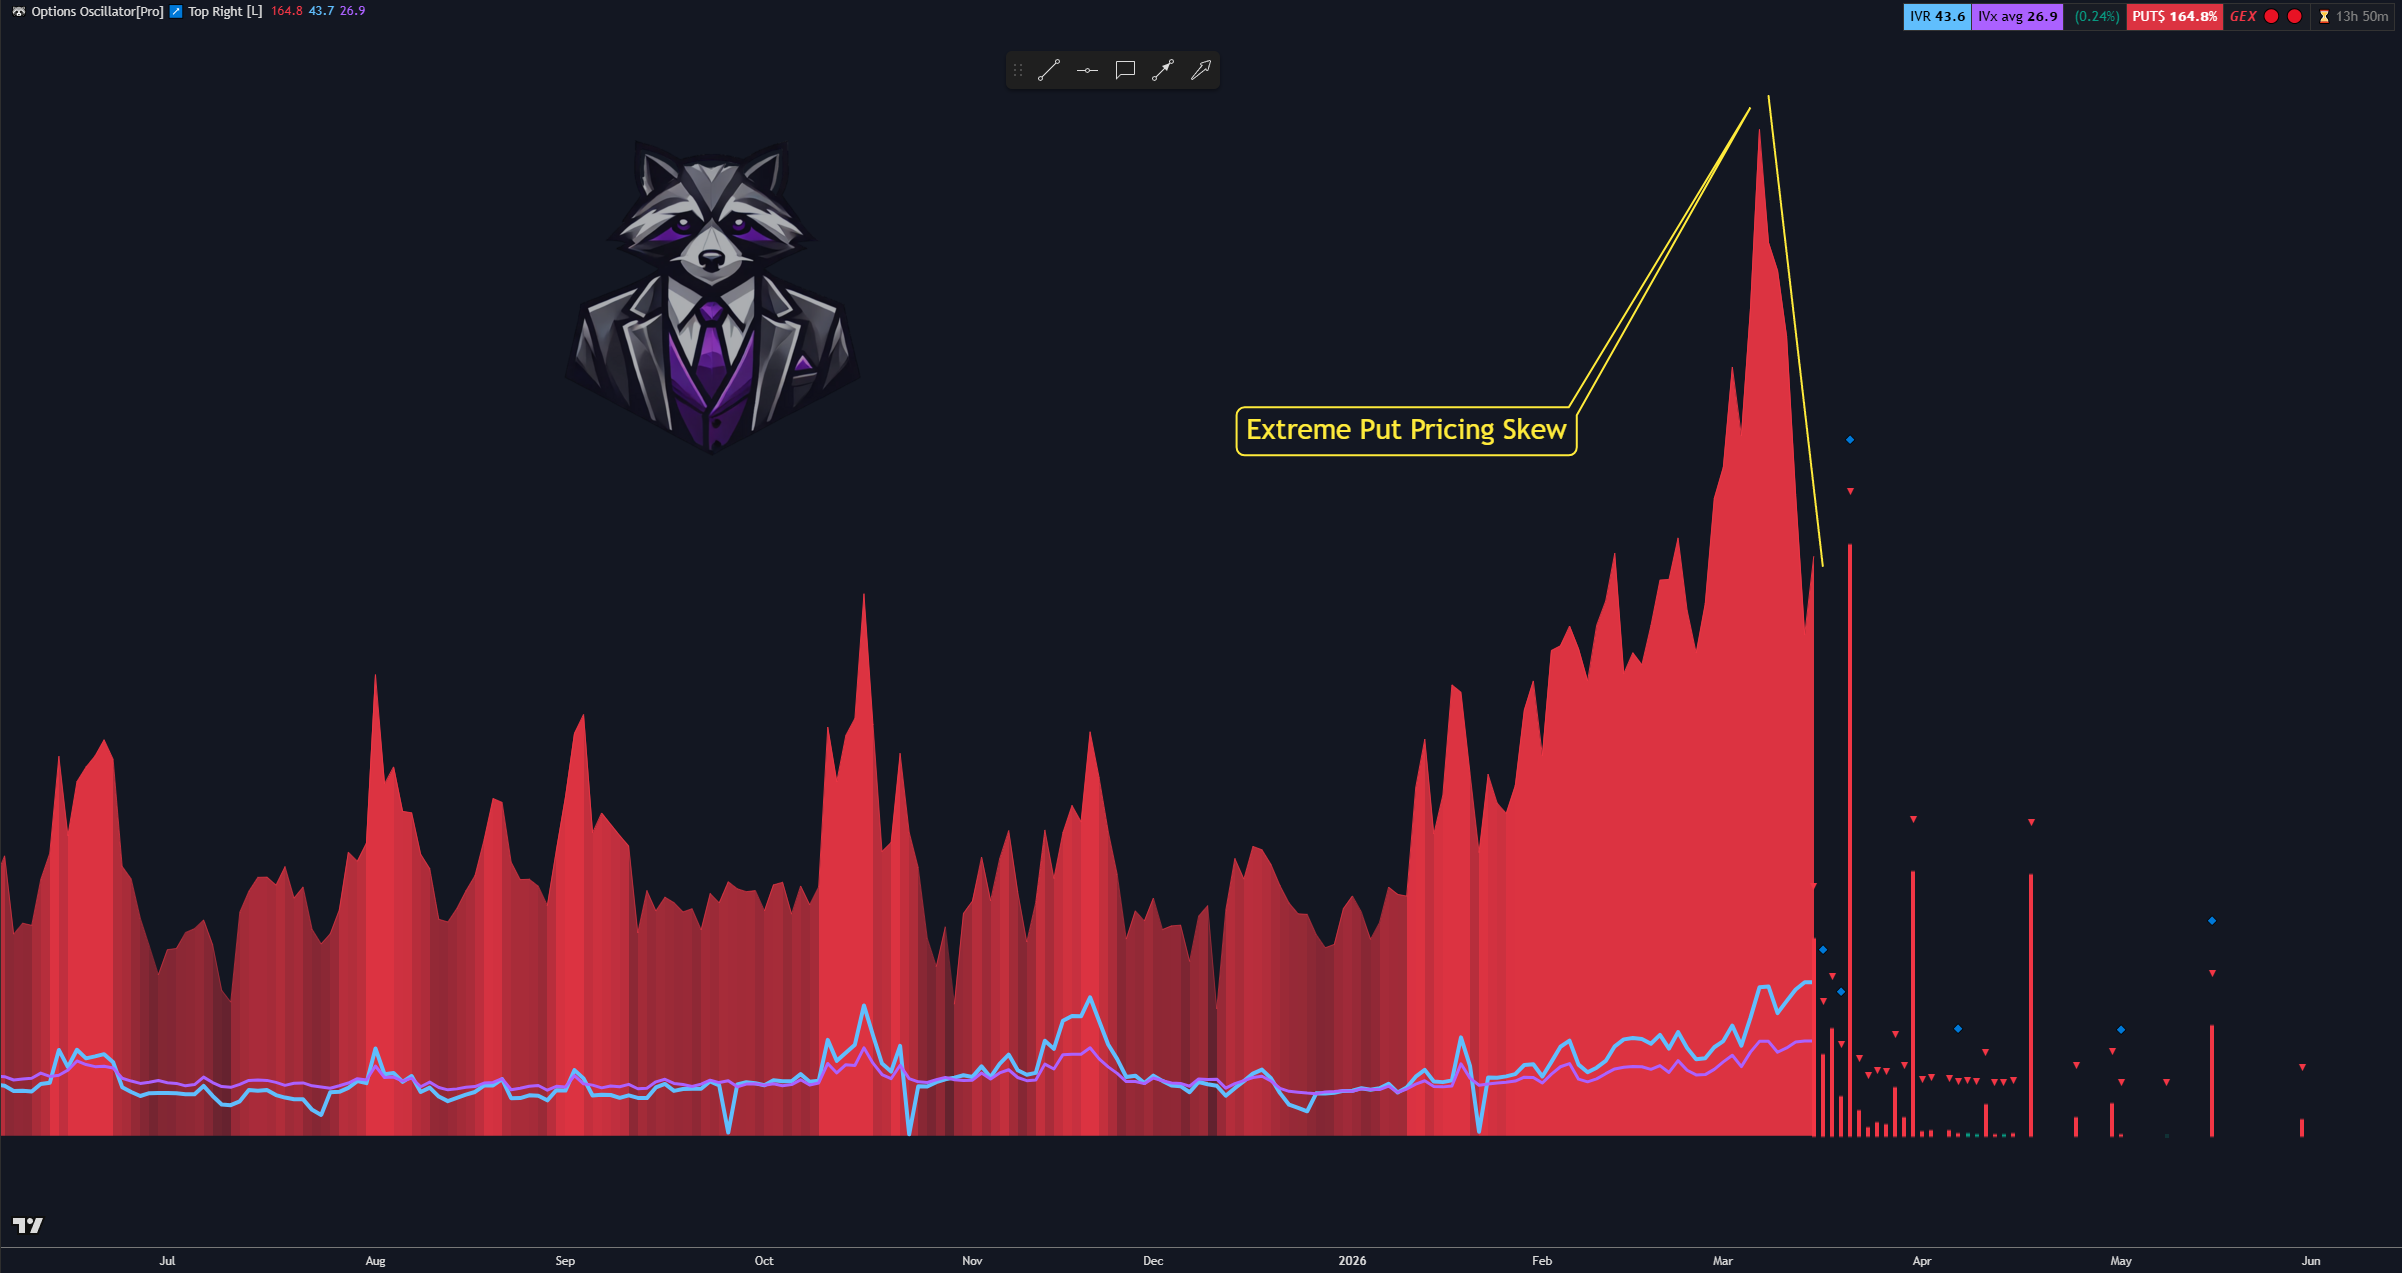
A similar normalization is visible across other indices as well.
This sharp decline in skew suggests that the peak phase of defensive hedging may already be behind the market, even though macro uncertainty remains elevated.
🔶 Nasdaq Relative Strength
One notable development over the past week has been the relative strength of technology stocks.
While the broader market struggled, the Nasdaq held up better than the S&P 500. The XLK technology sector ETF even managed to close slightly positive last week, despite weakness across several other sectors.
Looking at the QQQ chart, an important technical level becomes clear.
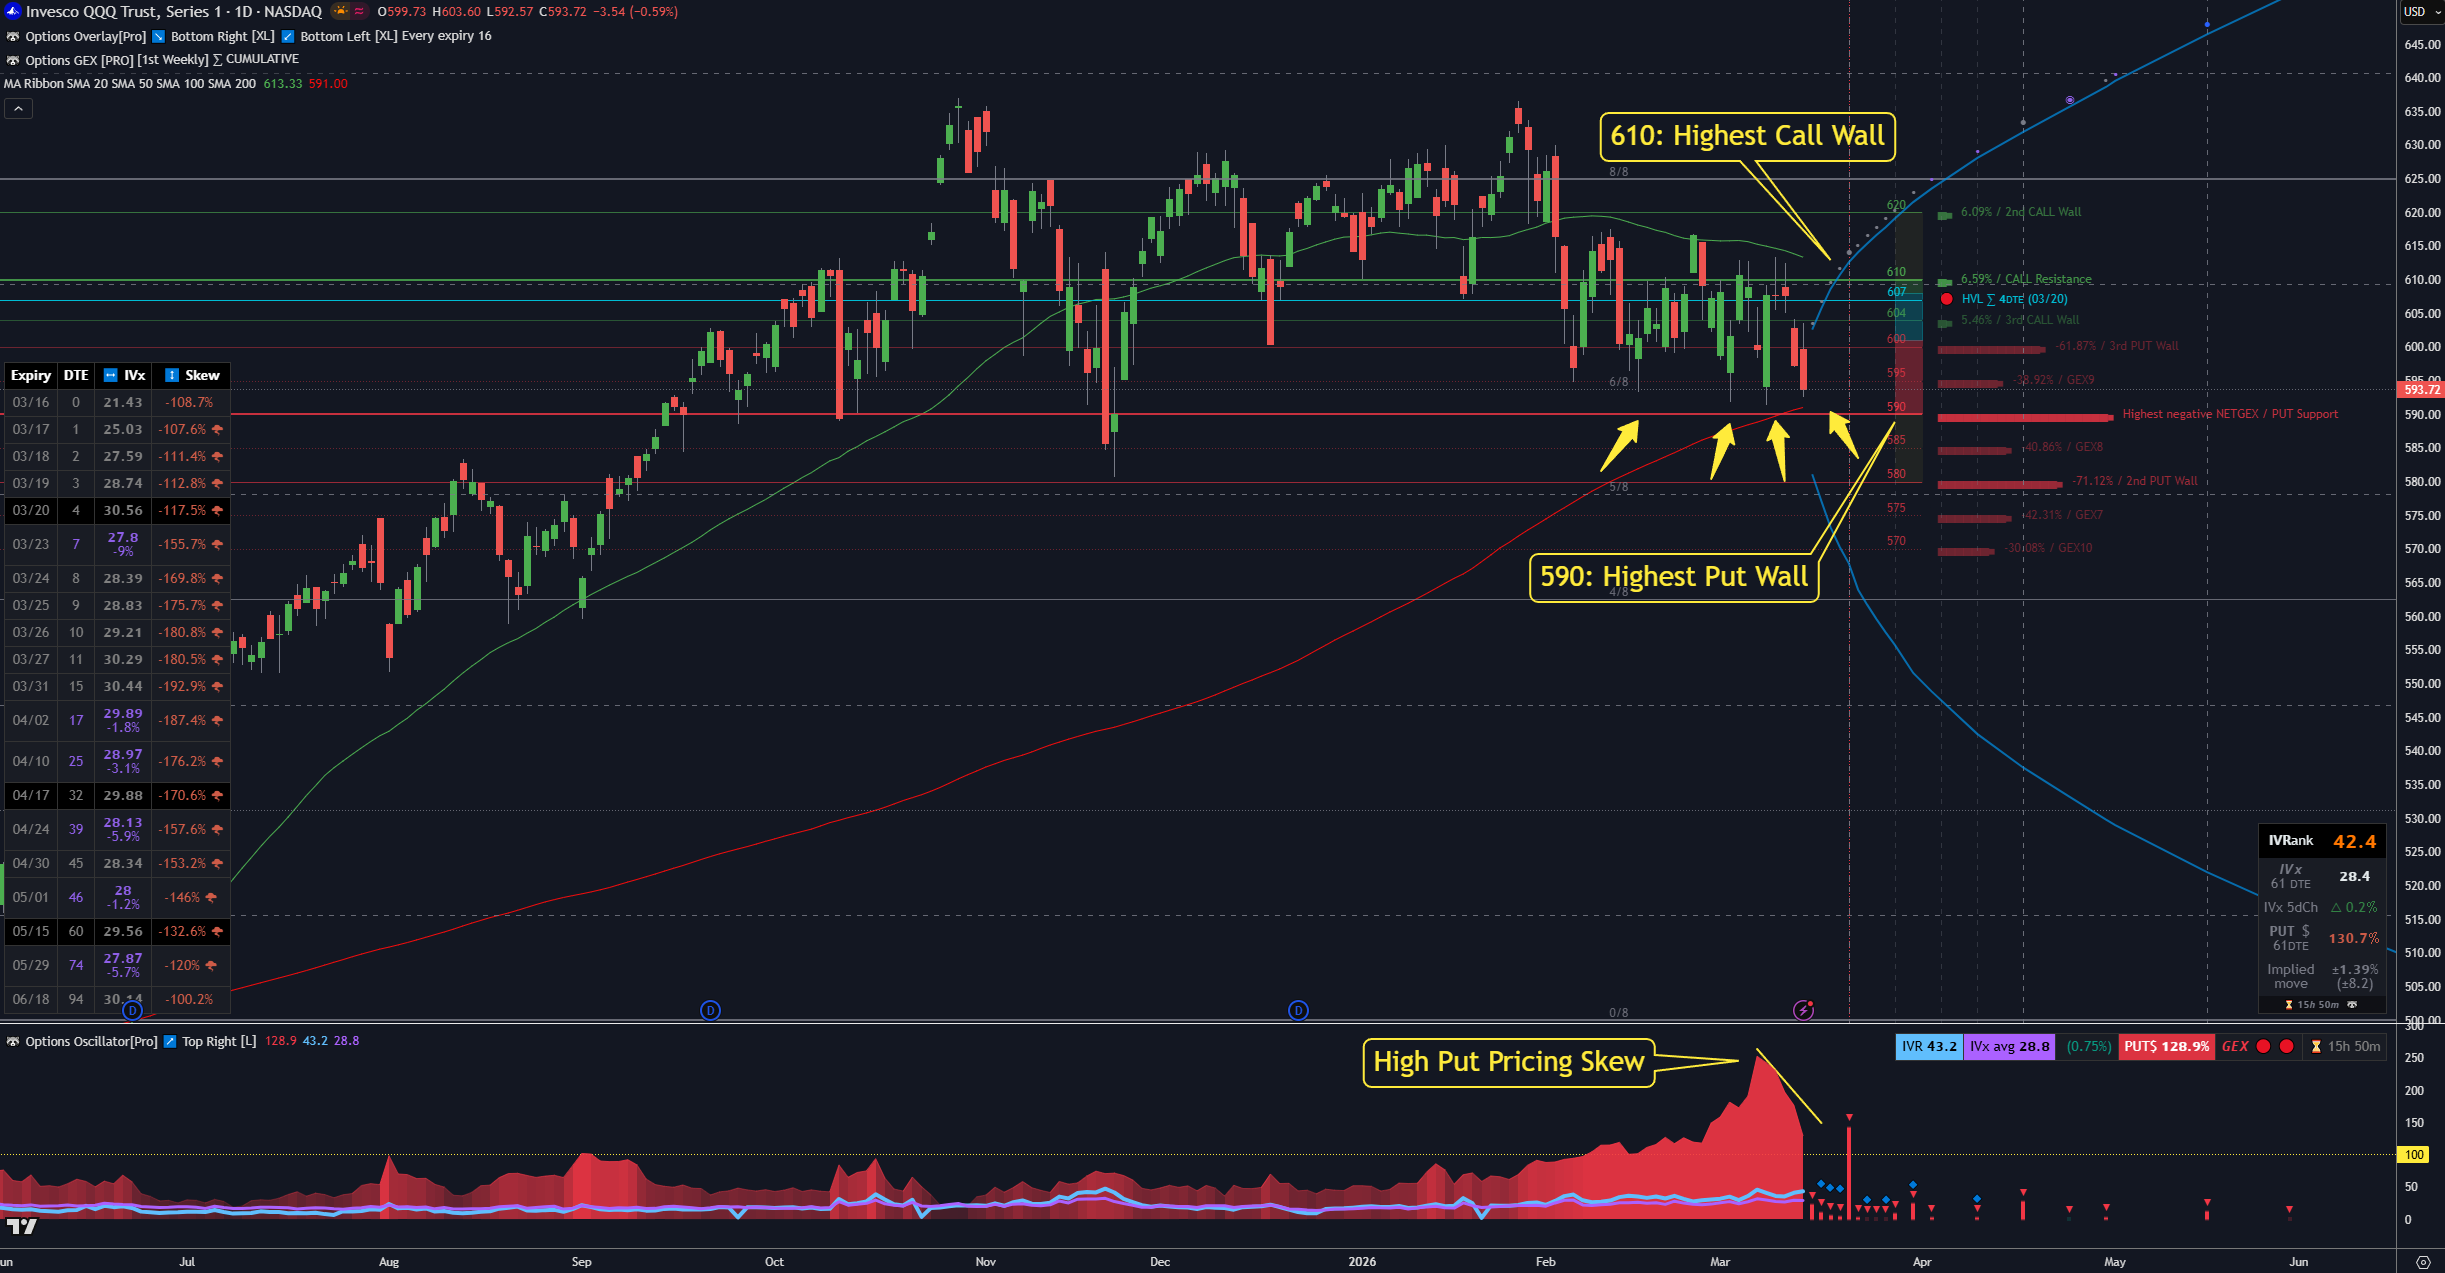
The 595 area has now been tested four separate times, and each time the market managed to hold that support without a meaningful breakdown.
From an options positioning perspective, the current structure is also quite clear.
The largest positioning clusters are currently located around:
590 → largest put wall
610 → largest call wall
This effectively places QQQ inside a 20-point positioning corridor, where dealer hedging activity may influence price behavior.
Another interesting development is visible in the put pricing skew.
Over the past week the skew has declined significantly. At the peak of the recent volatility spike, QQQ’s put pricing skew briefly reached around 250%, reflecting extremely strong demand for downside protection.
Since then that level has fallen to roughly half of that value, indicating that the demand for protective puts has eased considerably.
The same dynamic can also be observed in the broader market.
On the S&P 500, the put pricing skew previously peaked near 300%, but has since declined toward roughly 150–160%.
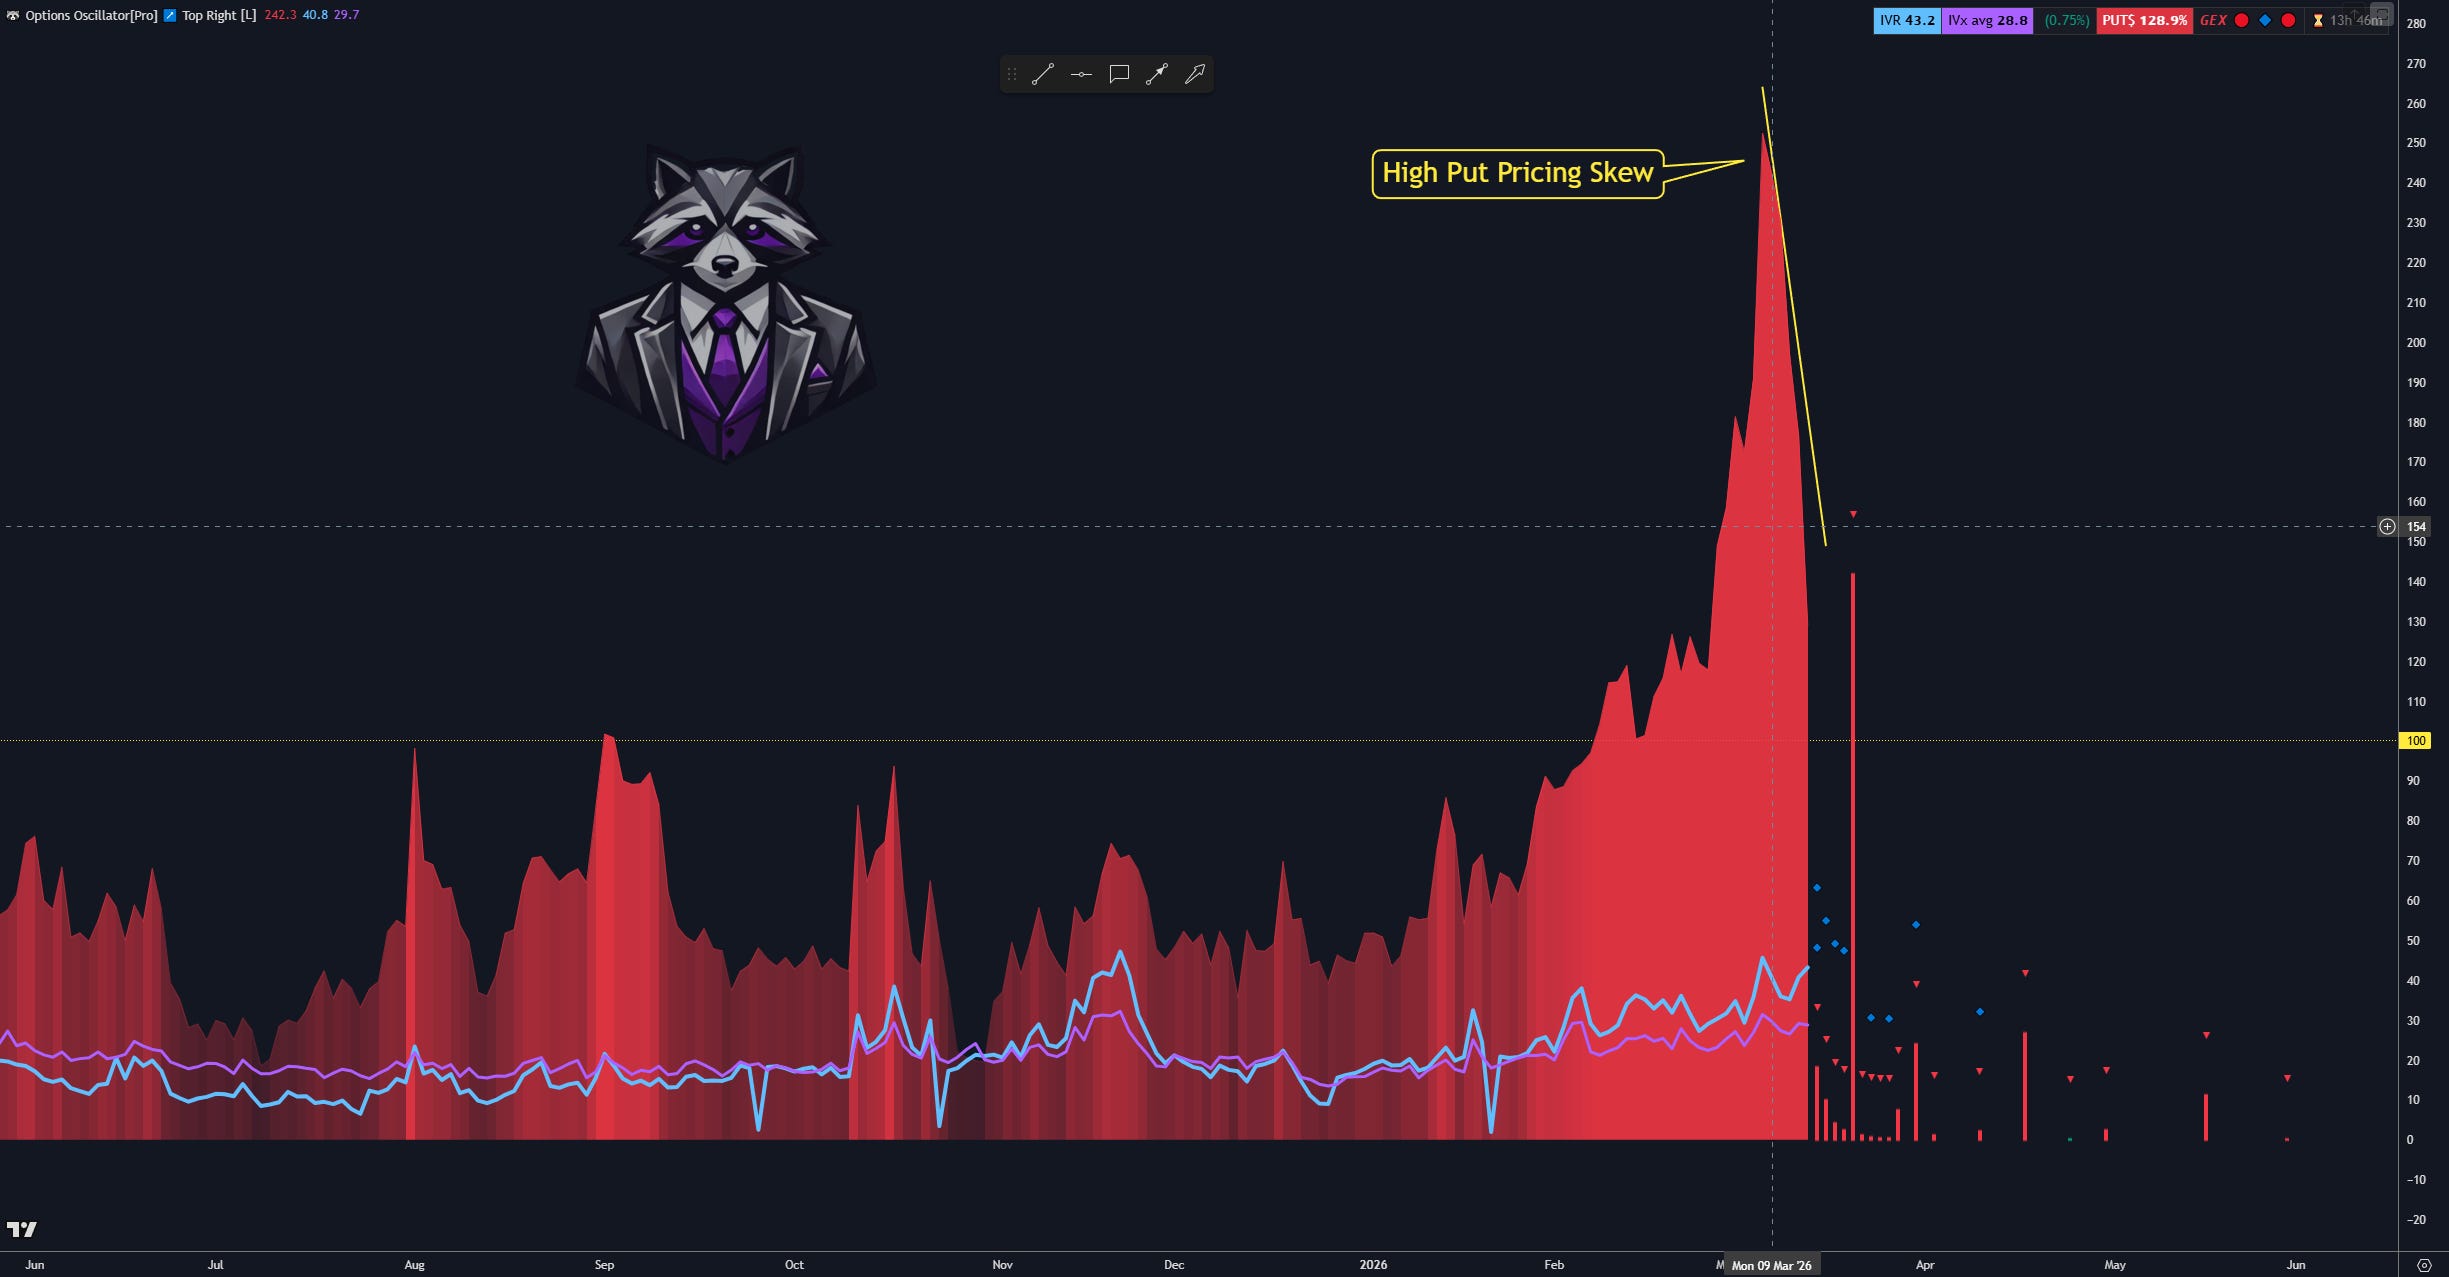
This rapid normalization suggests that a large portion of the panic-driven hedging activity has already been unwound over the past week.
When put demand collapses this quickly, it often signals that the most aggressive defensive positioning phase may already be behind the market.
🔶 VIX — Panic Spike and Cooling Volatility
Volatility also reacted quickly to the geopolitical developments.
During the week the VIX briefly surged toward 35, reflecting a sharp increase in hedging demand as investors sought protection against downside risk.
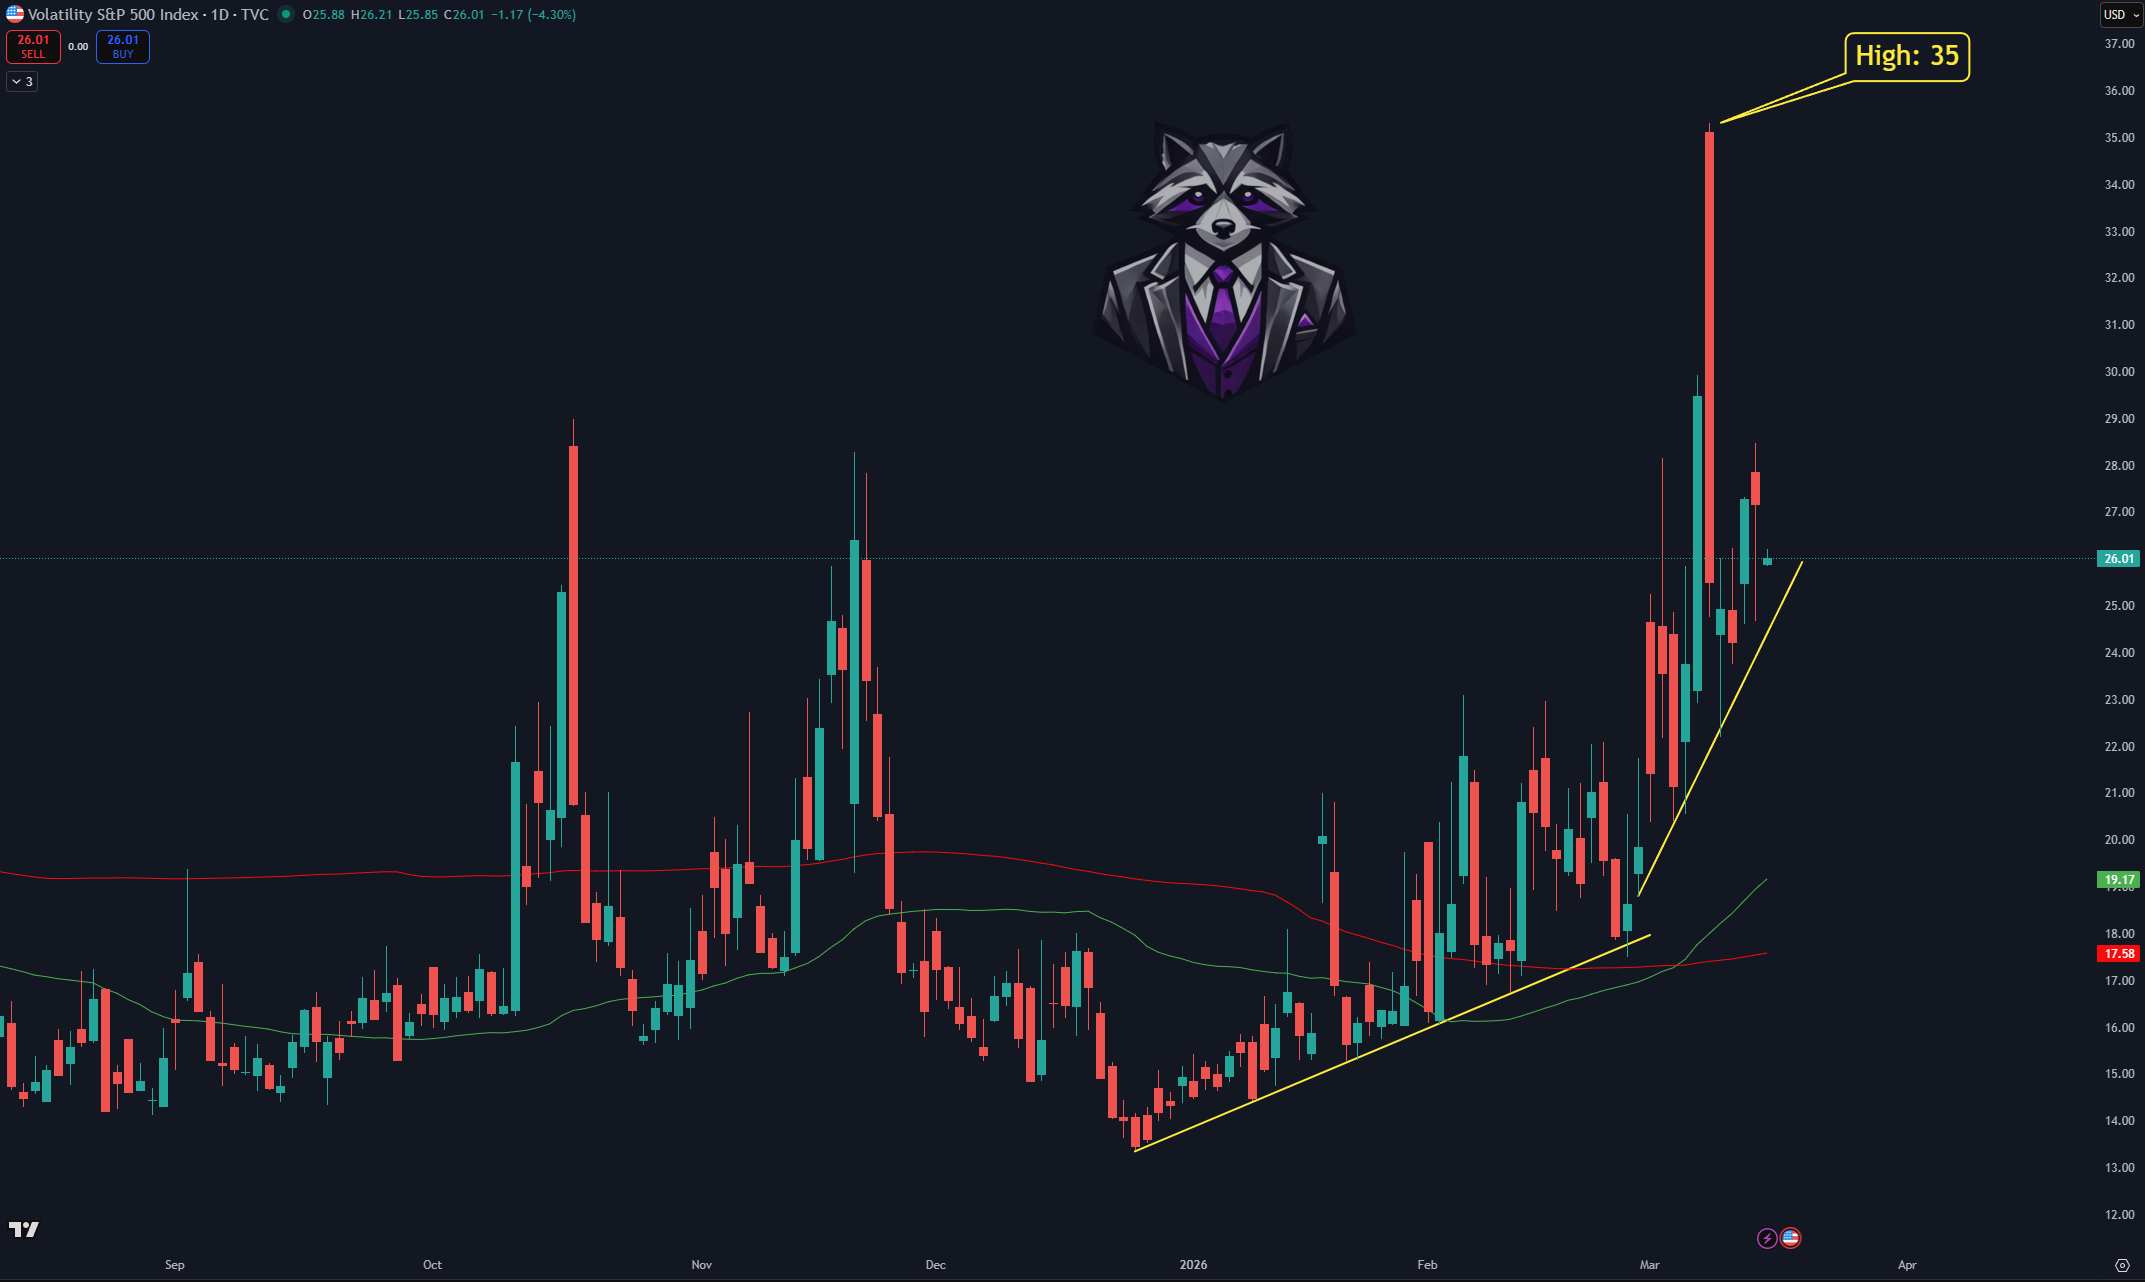
Since then volatility has moderated, with the index retracing a significant portion of the spike but you can see the upward trendline is much steeper than before.
This pattern is typical during geopolitical events:
initial shock triggers rapid hedging activity
option premiums expand quickly
volatility begins normalizing as panic subsides
The market remains highly sensitive to headlines. Any escalation around energy infrastructure or shipping routes could easily trigger another volatility expansion.
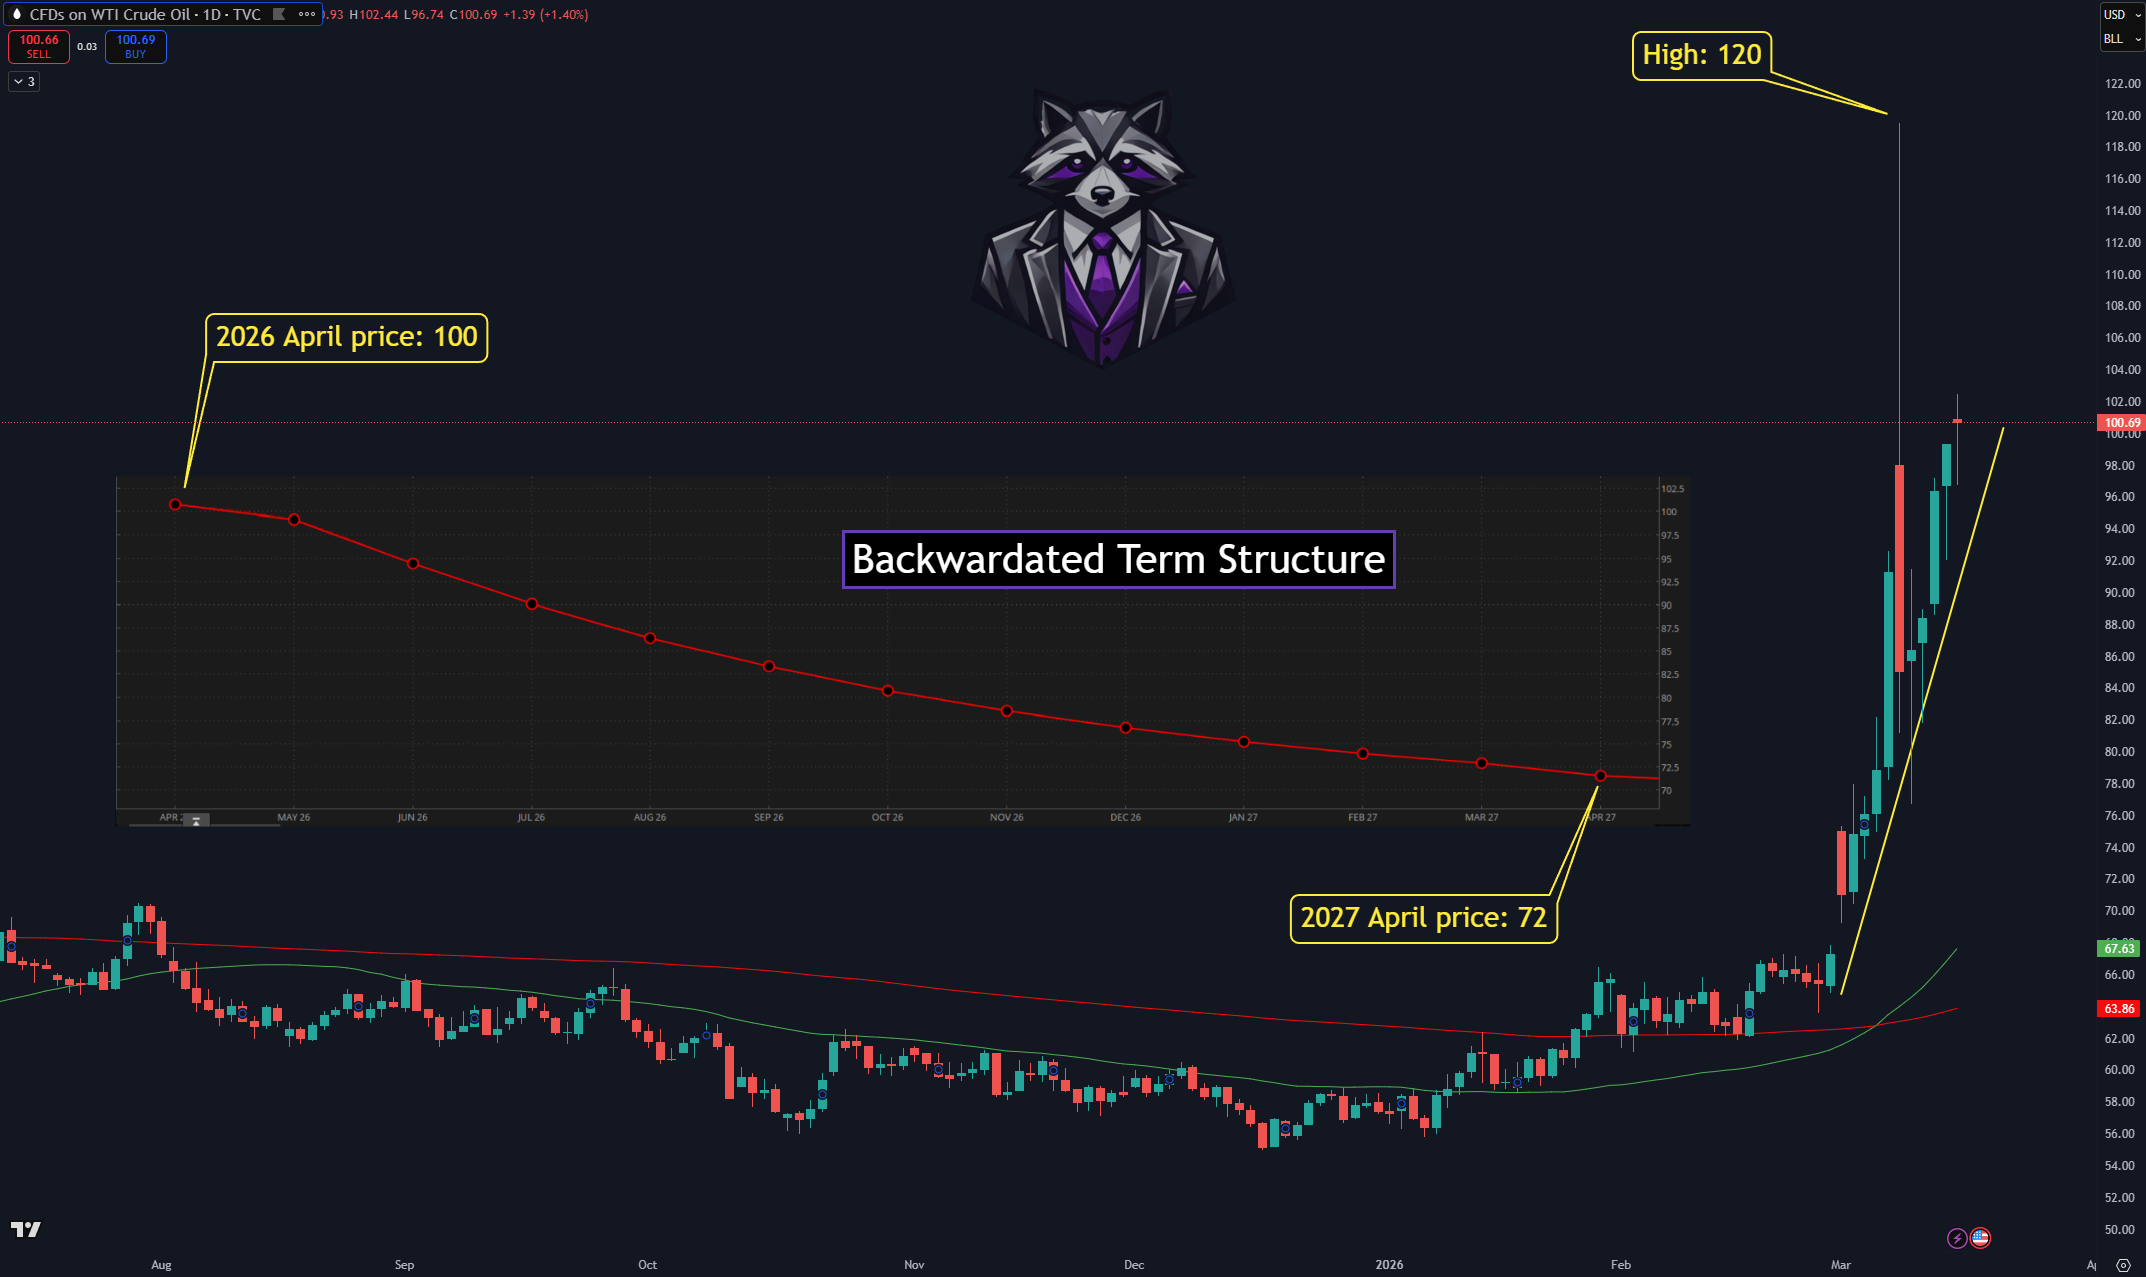
🔶 Oil Market — Backwardation and Supply Stress
Oil markets are currently showing a structural signal that deserves attention.
The futures curve has shifted into backwardation.
Under normal conditions, oil markets tend to trade in contango, where longer-dated futures contracts are priced higher than near-term contracts. That structure reflects stable supply expectations and storage costs.
Backwardation tells a different story.
When near-term contracts trade above longer-dated futures, the market is pricing immediate supply stress.
That is precisely what we are seeing now.
Energy traders are focusing on the possibility of disruptions to oil flows through the Strait of Hormuz — one of the most important shipping routes for global crude supply.
The current oil price sits around $100 per barrel.
For context, previous oil shocks peaked at significantly higher levels:
2022 energy crisis: roughly $129 per barrel
2008 commodity supercycle: approximately $147 per barrel, which remains the historical high
Current prices are well below those extremes, but the speed of the recent move highlights how quickly markets are repricing geopolitical supply risk.
One important signal to watch going forward is the shape of the oil curve.
A return toward contango would suggest that supply concerns are easing and the energy market is stabilizing.
Until that happens, oil will likely remain one of the primary drivers of global risk sentiment.
🔶 Live Trade Example — USO Call Diagonal
Below you can see a live trade example built around the recent oil volatility using a call diagonal spread.
During the geopolitical escalation around the Strait of Hormuz, oil prices surged sharply and implied volatility expanded significantly. At the same time, call options on USO became extremely expensive due to a sharp increase in call pricing skew.
This type of environment often creates opportunities for time spread strategies, such as diagonals.
A call diagonal is constructed by buying a longer-dated call and selling a shorter-dated call at a nearby higher strike. The structure benefits from several factors simultaneously:
directional movement in the underlying
time decay from the short option
elevated implied volatility in the front expiration
In this particular case the idea was that oil could continue pushing higher, but that the short-term move might slow down near an important call gamma level. That allowed the spread to reprice very quickly as volatility and skew expanded.
If you’d like to see how this live position was opened, managed and scaled out step-by-step, watch the full walkthrough below.
👇 Here is the video walkthrough of the position:
🔶 Macro Calendar — Inflation Data and the Fed
The upcoming week brings several key macro events that may interact with the current energy shock.
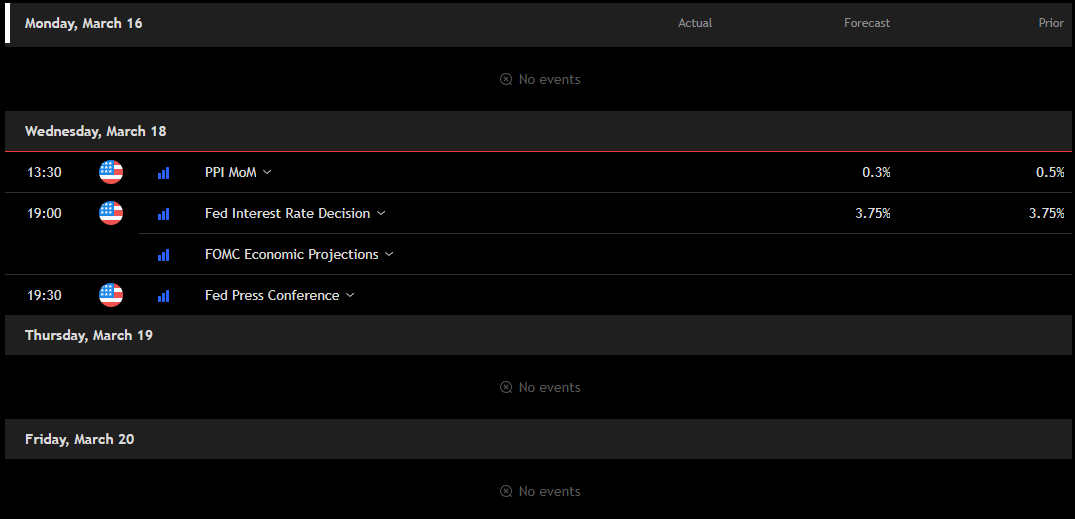
Important releases include:
PPI
FOMC meeting
Energy prices play a direct role in inflation expectations, which makes these releases particularly relevant right now.
Market pricing currently implies roughly a 99% probability that the Federal Reserve will not cut rates at the upcoming meeting.
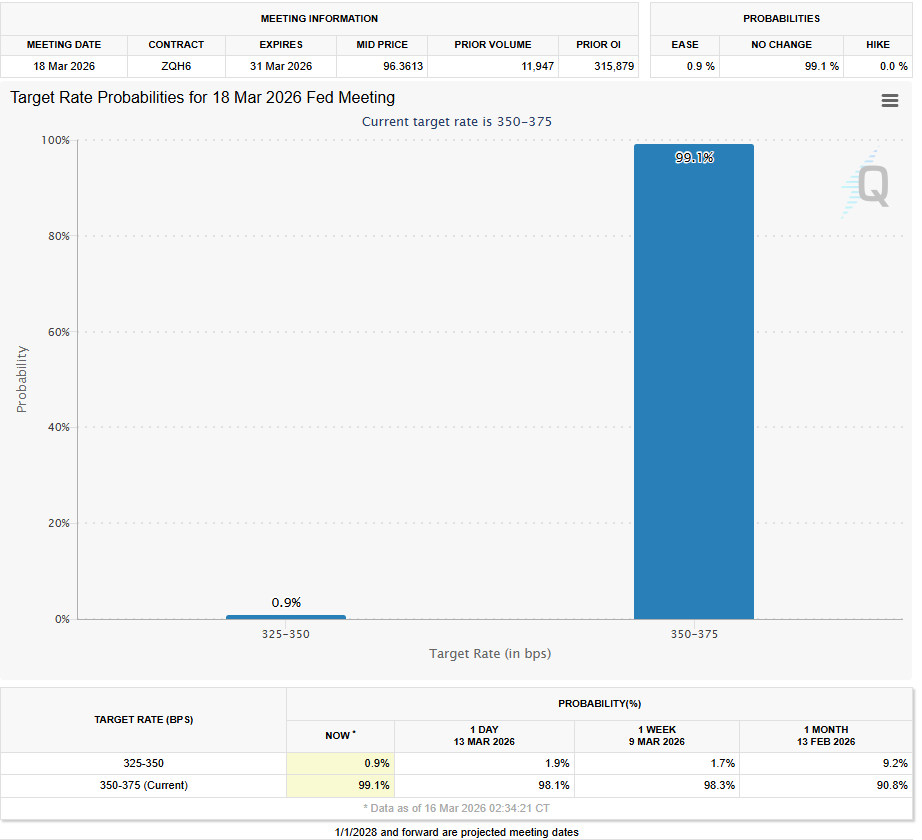
However, the most important aspect will likely be the tone of the Fed’s communication.
If policymakers emphasize the inflationary implications of higher energy prices, markets may interpret that as a signal that the central bank intends to remain cautious with future rate cuts.
In an environment where oil is rising, the Fed’s messaging will carry significant weight.
🔶 Earnings Watch — Micron
Most of the earnings season has already passed, but one important report remains on the calendar.
Micron Technology (MU) will report earnings this week.
Micron plays a key role in the semiconductor supply chain and is closely tied to AI-related demand for memory and data-center infrastructure.
Because of that positioning, the report could influence sentiment across the broader semiconductor sector.
🔶 Final Thoughts
Markets are currently responding to a powerful macro driver: energy.
Oil prices, geopolitical tensions, and positioning dynamics are interacting at the same time, creating a market environment where headlines and macro signals move prices quickly.
For traders, several indicators will remain particularly important in the coming days:
oil price behavior
the term structure of the oil futures curve
SPX positioning levels
volatility dynamics
When macro drivers dominate market behavior, price action tends to adjust rapidly.
Maintaining flexibility in positioning and paying close attention to cross-asset signals can provide valuable context as this environment evolves.
⚠️ Trade with flat-delta, high risk-reward structures, keep your positioning adaptable, and always monitor the GEX levels and the surrounding gamma environment — they’ll tell you more about the path ahead than the headlines ever will!
You can find additional valuable content on our YouTube channel, and if you feel like trying out our
⭐ GEX-Live Charting View, you can do so with a 7-day free trial here: ⭐
https://tanukitrade.com/
This material is for educational purposes only; TanukiTrade is not a financial advisor, and nothing here constitutes investment advice or a recommendation.