
03/17 Your GEX Bots Unleashed: Your Ultimate Weekly Market Roadmap
$COIN Example: IV Trends & Strategy Considerations. Reading Gamma Shifts: How GEX Bot Data Guides Swing Traders. How GEX & DEX Interplay Affects Daily Volatility.

Finally, the moment everyone’s been waiting for has arrived: we’ve made our custom GEX Bots available on Discord! Now you can get GEX data refreshed every 20 minutes, even intraday, so you don’t have to wait around for our next TradingView update. On top of that, we can show you way more data than we ever could on TradingView.
IMPORTANT: This extra service is available to every PRO member subscriber in the 🤖│options-gex-bot channel on our Discord server!!!

Good news is, many of you have already been using these bots since last friday, and so far they seem totally stable—no issues reported by you or found by us. So, for weekly market outlook, I’m going to base everything on these new GEX Bots + Tradinview GEX indicator, so you can see how much simpler life has become with them!
SPX 👀 How Do We Look After Two Days of Rally?
Although Friday and today have hinted that the brutal, weeks-long bearish bloodbath might be over, it’s still worth taking a closer look at the details.
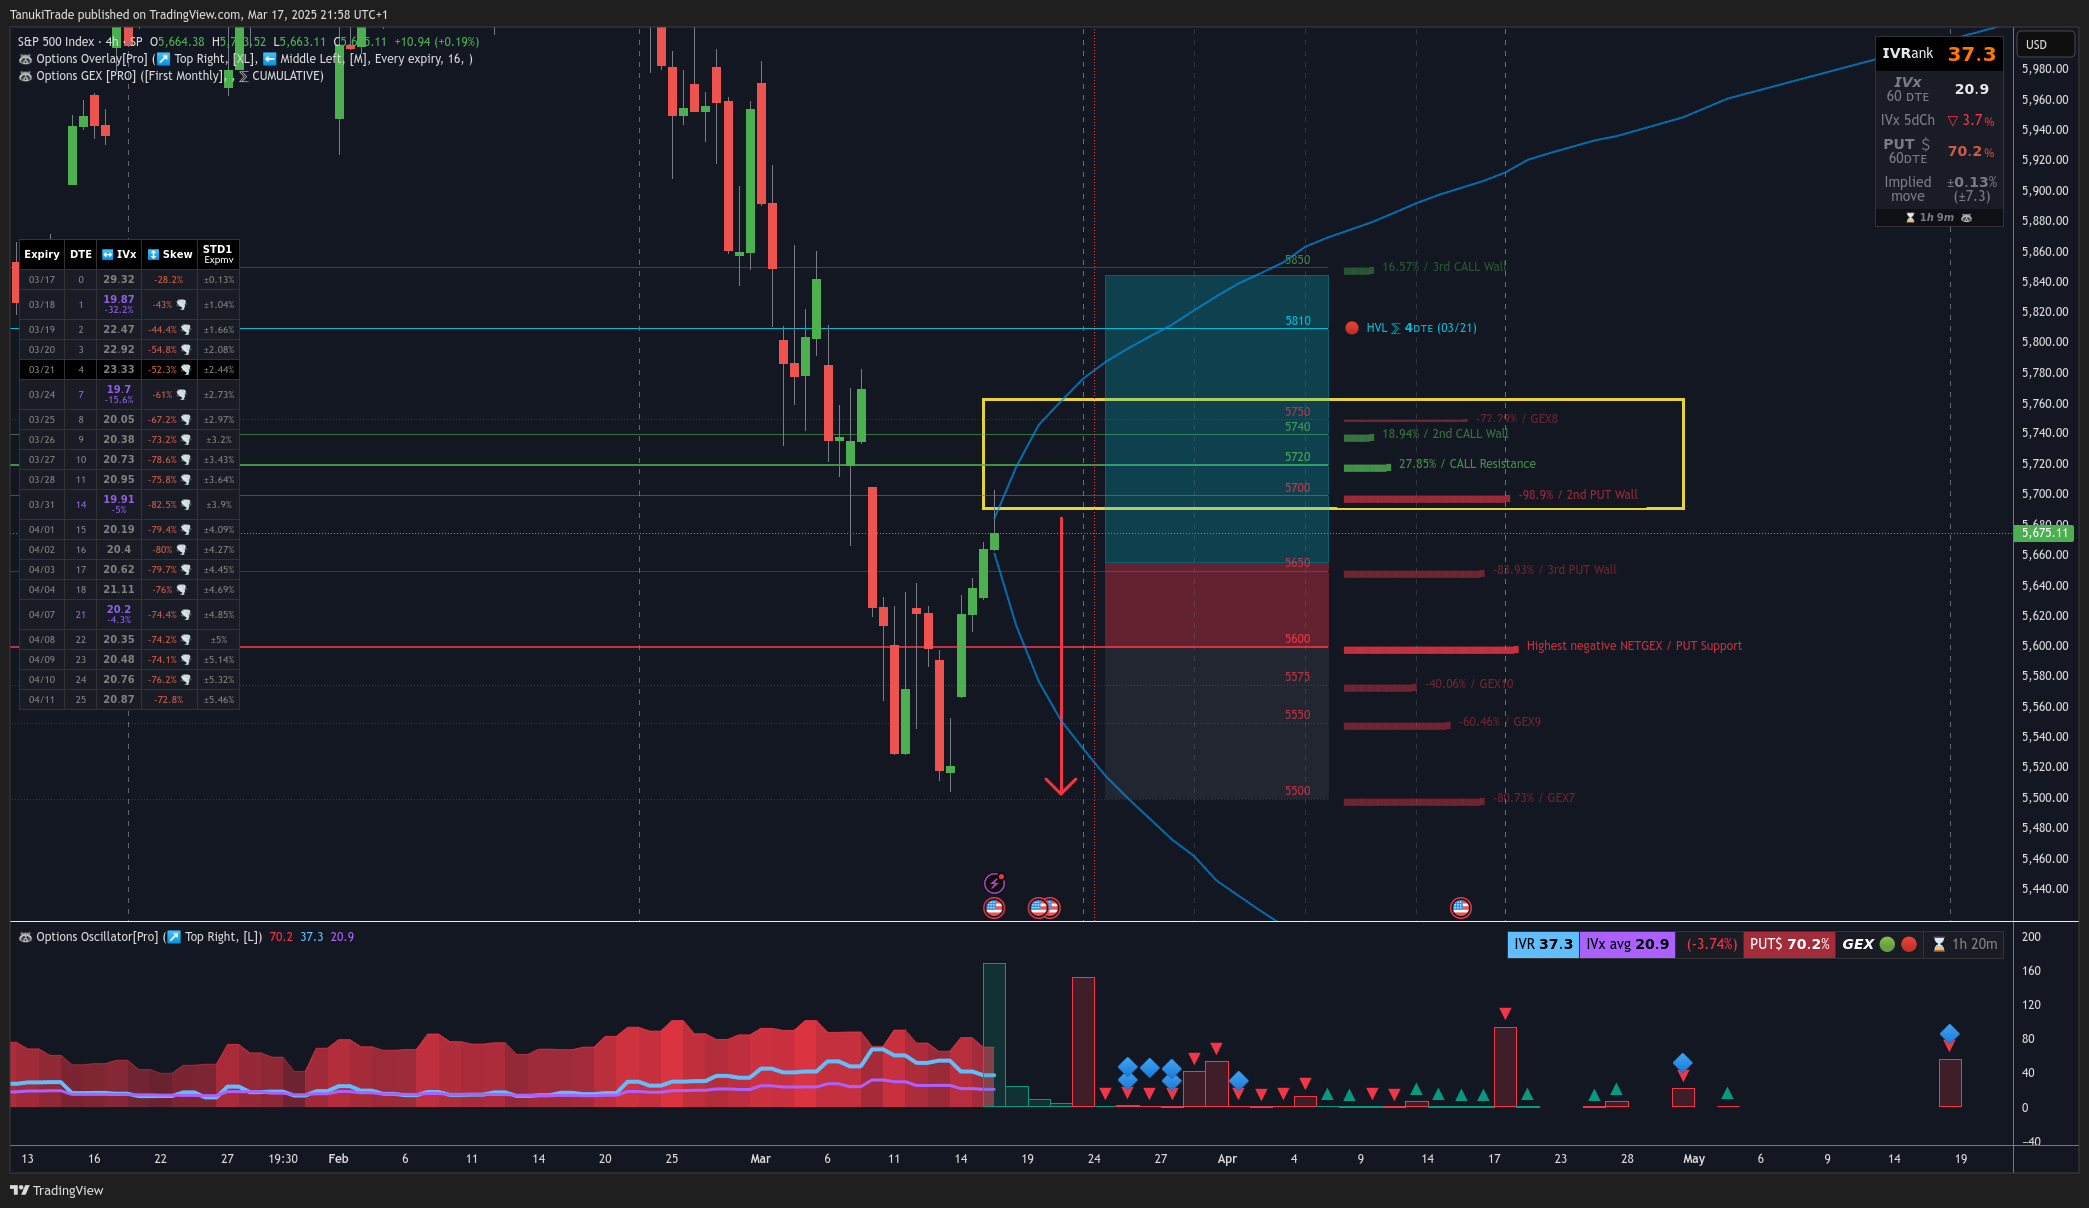
IV is dropping, put pricing skew is also slightly lower.
I see that it’s still a long way up if we want a more meaningful bounce.
There’s a notable level cluster around 5,700–5,750.
🟦 HVL (High Volatility Level): 5,810.00 — If SPX gets near this level, expect heightened volatility.
Pivotal Transition Levels
🔵 PTrans- (Put Transition Level): 5,655.00 — A key area where put-driven support may shift.
🔵 CTrans+ (Call Transition Level): 5,845.00 — A breakout above here would lead to a strong bullish move (though it feels almost impossible before Friday).
🤔 Might seem gamma-flip unusually far from here, but let’s deep dive in exactly why!
🤖 Pulling additional Data from Our new GEX Bot
I use the command ‘/gexw1 SPX’ in our 🤖│options-gex-bot Discord channel. It shows cumulative GEX data (excluding 0DTE) up to this Friday, and here’s what I notice:👇

Below the spot price, everything is still put-dominated.
Net DEX remains negative under the spot, which makes sense from a hedging standpoint. We’d need net DEX and OI also turning negative around the spot for a real hard “micro bearish” sentiment shift again.
🔴 Put Support:
5,600.00 — A key floor, with a potential negative squeeze zone down to 5,500.
🟢 Call Resistance:
5,720.00 — A heavy call position that can form an upside barrier.
🔥 My attention goes to a “yellow box,” where although the top positive gamma exposure is at 5,720, the net open interest around that level is still overshadowed by puts.
🔍 For a More Detailed Breakdown: /matrix SPX
If I want to see how each expiry up to Friday is shaping up and changing, I just enter the /matrix SPX command:

Once I run the command, I get more details on how open interest and gamma changed over the last day, which are super important:
Only 03/21 Gamma Exposure (GEX): 📈
Net GEX: -268.44M (negative gamma generally signals higher volatility and potential market instability).
1-Day GEX Change: (+67M) — so negative GEX has decreased, but it’s still significantly negative overall.
03/21 Net DEX: -278.3B (heavy negative delta exposure means strong hedging against drops). 📈
1-Day Change: +24.2% (+90.39B) — still negative, but less so than on Friday.
The largest negative exposure is tied to this month’s expiry (this Friday). The open interest and GEX are deeply negative, which pushes the cumulative HVL up to around 5,810 going into March 21.
Because of this, I don’t expect a strong technical breakout before Friday. A real charge at 5,820 would require a big shift in sentiment from 5,675, which doesn’t seem realistic right now.
💡 25.9% of the total SPX open interest is concentrated in this Friday’s expiration, which is why analyzing it is so crucial! Everything is currently quite negative, and that imbalance exerts significant influence on the overall outcome.
This basically means traders are slightly backing off their protective positioning at the moment, but the broader sentiment is still firmly in the bearish/put-heavy camp.
Given the current GEX configuration, I see this bounce as more of a dead-cat bounce than a genuine reversal. Friday’s robust hedging activity and the broad transition zone suggest we’re not at that major turning point yet—the market’s still pinned under a cluster of technical barriers above, with put-dominated strikes below.
SPX Analysis Summary
Negative GEX → Higher Volatility: The market may see sharper, more violent swings.
If SPX Falls Below 5,600 → Possible Acceleration Lower: Breaking that floor could trigger a fresh wave of hedging and selling, pushing us down to 5,500.
If SPX Breaks Above 5,720 → Potential Short Covering: A clear move through that level might induce delta-hedging shifts and spark a quick rally toward zero-gamma (5,810).
Keep an eye on these levels, stay hedged, and make the most of our Discord Gamma Exposure Bots for near-real-time updates. As always, feel free to drop any questions or comments in the channel or shoot me a direct message.
📅 Weekly Economic Outlook

1. Interest Rate Decisions & Monetary Policy
FOMC (March 19): The Federal Reserve is expected to hold rates at 4.50%. Market pricing suggests a 25 bps cut in June, but risks are tilted toward a total 75 bps easing by year-end if economic data weakens further.
2. Economic Data & Macro Trends
US Retail Sales (March 17): February's data showed a -0.90% decline, reflecting weak consumer demand.
US Building Permits (March 18): Forecast at 1.473M, indicating housing market activity.
3. Market Impact & Options Context
US Interest Rate Policy: Potential Fed rate cuts could boost equities and push bond yields lower. Lower implied volatility (VIX) is possible, but economic risks may keep put options relevant for hedging.
Oil Markets & Geopolitics: OPEC+ decisions, US sanctions, and the Russia-Ukraine war could keep Brent crude within the $65-$80 range, impacting energy sector options premiums.
4. Market Outlook & Key Moves
SPX & QQQ: The Fed’s cautious stance may stabilize indices, but global trade war risks could cap gains.
EUR/USD: Expected strengthening as the ECB is likely to cut rates in April, combined with Germany’s stimulus efforts.
💡 How I Use IV & GEX to Pick the Right Trade
On my end, I use the following indicators as top-level metrics, and based on these, I mentally decide whether to apply or rule out a particular strategy. Those are included into our Gex Profile and Options Overlay for Tradingview.
IVR
IVx
IVx 5-day change % (at least as important as the ones above)
Call/put pricing skew and its changes
All of these are only applicable for swing trading (i.e., over a multi-day time frame); they are not meaningful for intraday or day trading.

A perfect example is COIN: for me, the key factor is seeing that IV is trending downward, and there are no upcoming earnings that could change that. So, the main goal is to choose a strategy that benefits from a decreasing IV environment. For instance, I wouldn’t choose a time spread, because it’s vega-sensitive and works best in a rising IV environment.
Since IVx is high, it may be possible to find a strategy that offers a good premium. However, IVR is not as high (as you also pointed out), which simply means that over the past year, IVx has been able to remain at significantly higher levels—so for COIN, it might be entirely normal for IVx to be, say, twice as high as its current value. This is important for a 60 DTE strategy, as I wouldn’t go too far out; it signals to me that within that time frame, IVx could easily double, for whatever reason.
For swing trading, I would choose a maximum expiration of 30 days and a strategy that plays on IV contraction. The CALL pricing skew has persisted, only dropping during the major correction, so I’m looking for a strategy that can capitalize on both IV contraction and call pricing skew. One such strategy could be a PUT broken wing butterfly (BWBF).
However, I’m not done yet—this is a directional strategy. So, how should I set the net delta of my trade: positive, negative, or neutral?
This is where GEX levels come into play for me. We are in a positive gamma environment, primarily driven upward by the current Friday expiration. It’s clearly visible that after the 02/21 expiration, the net GEX outlook is less positive, but I also see that it can change quickly. Quick check by typing into the 🤖│options-gex-bot-pro channel: /matrix symbolname: COIN.

If I expect a slight upward move, then for April, a short strike at 210 with a lower breakeven at 180 could be a solid target—especially since call resistance levels are at 195, 210, and 205, and I wouldn’t hold the position all the way until April 11 either.
I’d place a stop around the 180 level, since over time, the BWBF tends to open up below that, and I’d monitor the 210 level upward, which is around a 36 delta on the short side—so it’s quite close. If that level is reached, I would either close the position or open a similar 2x structure above it (for management or transformation purposes).

But just look at how the BWBF already covers the 180–210 range after just 5 days! If IV contracts further, even better. If IV increases, which could lead to a potential drop, then right at the mentioned 180 strike, if it closes there, I would cut the position and take the loss.
My goal is to close within a maximum of 1–2 weeks and capture a 5–10% profit.
❗ NOTE: I personally consider COIN’s multi leg bid/ask spreads to be too wide.
I assumed that the current weak trend will continue—meaning that IV will decrease rather than increase, and that COIN won’t experience an extreme move (i.e., it won’t move more than -5%/+10% within 14 days). If any of these conditions are not met, I’ll either manage my position accordingly or close it at a loss.
One final note: Regardless of how the position looks after 21 days, I would definitely close it due to the early assignment risk and the increasing gamma risk.
Well, that’s generally how I think, and I hope this mindset helps. 🚀
I hope you find the newsletter useful! What do you think of our new GEX bots on the channel? Have you tried them out yet? Which symbols would you like to see covered in our analysis? Let me know in the comments—plus, you can always find me on our Discord!