

The S&P enters the week closer to new highs than the Nasdaq, with a packed calendar ahead.
The S&P 500 rose 1.17%, the Nasdaq Composite gained 1.79%, and the Dow fell 0.41%. All three remain above their 50-day moving averages, so the broader trend is still positive.
The week ahead is more difficult. Major data, earnings, and monthly OPEX are packed into four sessions.
CPI hits Tuesday, PPI Wednesday, retail sales Thursday, bank earnings open midweek, and July OPEX lands Friday. Iran kept oil firm into the weekend; SK Hynix’s U.S. listing added another semiconductor headline to an already dense tape.

🔶 Big Picture Market Context
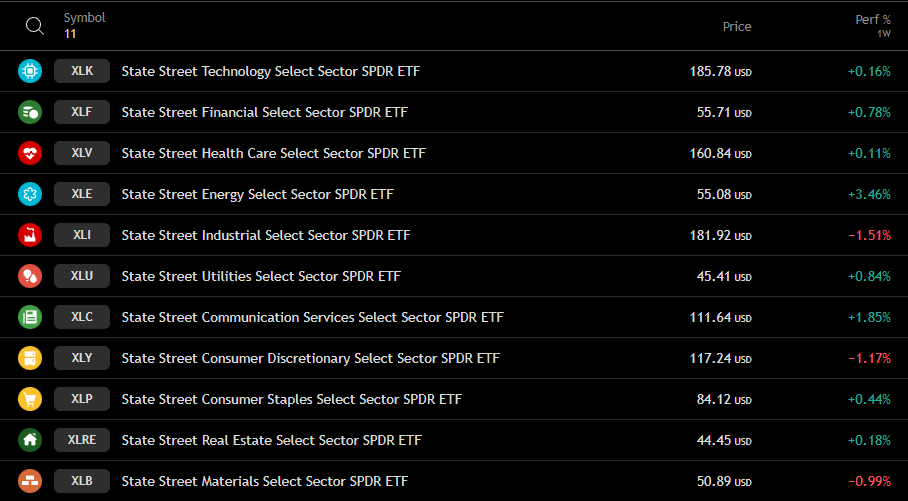
The headline index looks stronger than the average growth book.
Financials and cyclicals carried the S&P while XLK-heavy exposure underperformed on a relative basis. Crude gained on Iran headlines; Friday’s brief downside break was bought back within minutes.
🔶 SPX vs. NDX — Same Trend, Different Structure
SPX is closer to its previous high and sits more clearly above its 50-day average. Its short-term averages are also starting to separate.
NDX has recovered, but it still has more resistance overhead. Its shorter moving averages remain close together, which shows that the trend is less settled.
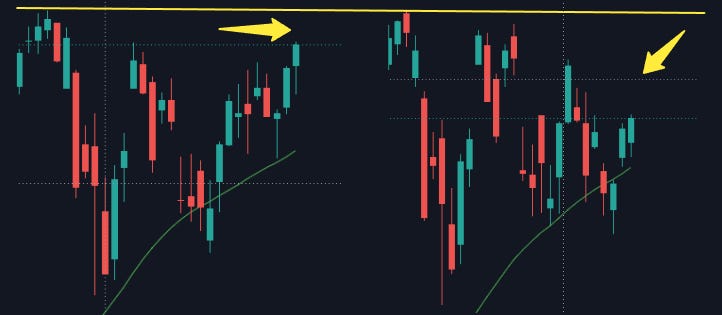
That fits the price action we have seen lately. Breakouts have failed, downside gaps have filled, and several moves have reversed within the same session. Confirmation matters more than the first move.
The S&P can hold up while large-cap tech pauses because financials and consumer stocks can carry more weight. For now, this looks like rotation inside an uptrend, not a broad market breakdown.
Oil is the extra risk. If the weekend move fades, equities may treat it as another short-lived shock. If crude stays higher, inflation concerns can return quickly.
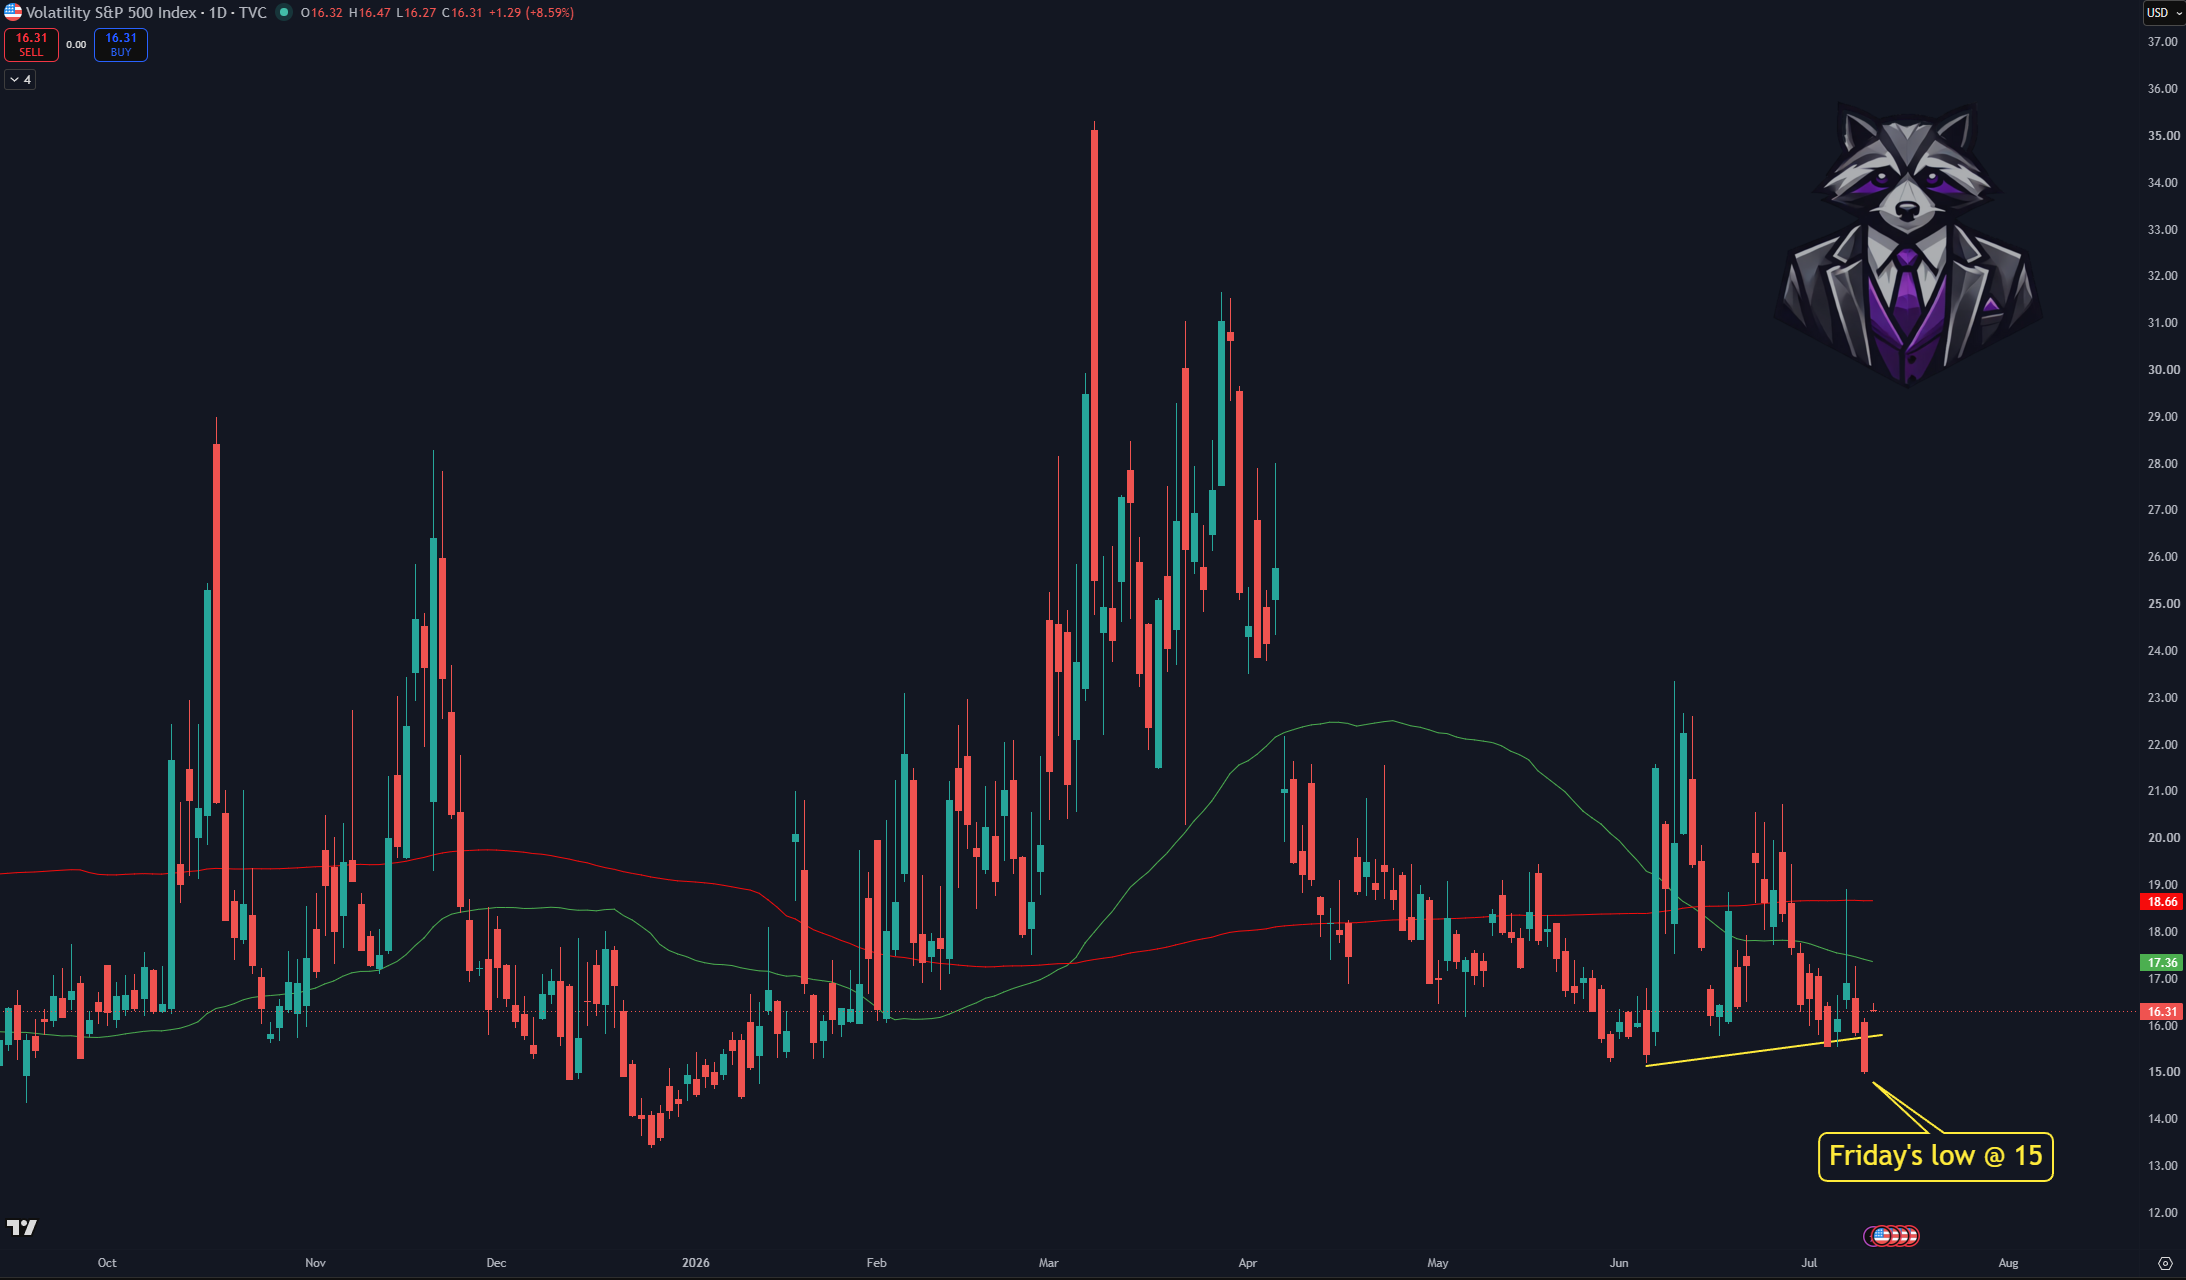
🔶 VIX — Near Its 2026 Low
Front-week SPX implied vol has collapsed into the event stack.
VIX pressed toward 15 last week before a modest weekend bid on Iran headlines. Cheap index vol and low teens VIX do not predict direction; they describe a market not paying much for a volatility expansion before CPI, bank earnings, and OPEX. The first surprise can still reprice premiums quickly from this starting point.
VIX near 15 is close to its lowest level of 2026.
🔶 SPX GEX Structure — Positive Gamma, Testing C1 Into C2/Ab1
SPX is carrying a supportive gamma profile into a dense macro week.
Spot at 7553 sits above 7495 HVL and the 50-day moving average near 7457, which keeps the index in positive gamma. The profile is not wide open overhead: 7575 C1 is the first call wall, and 7600 stacks C2 with Ab1 (absolute GEX) into a single overhead hub.
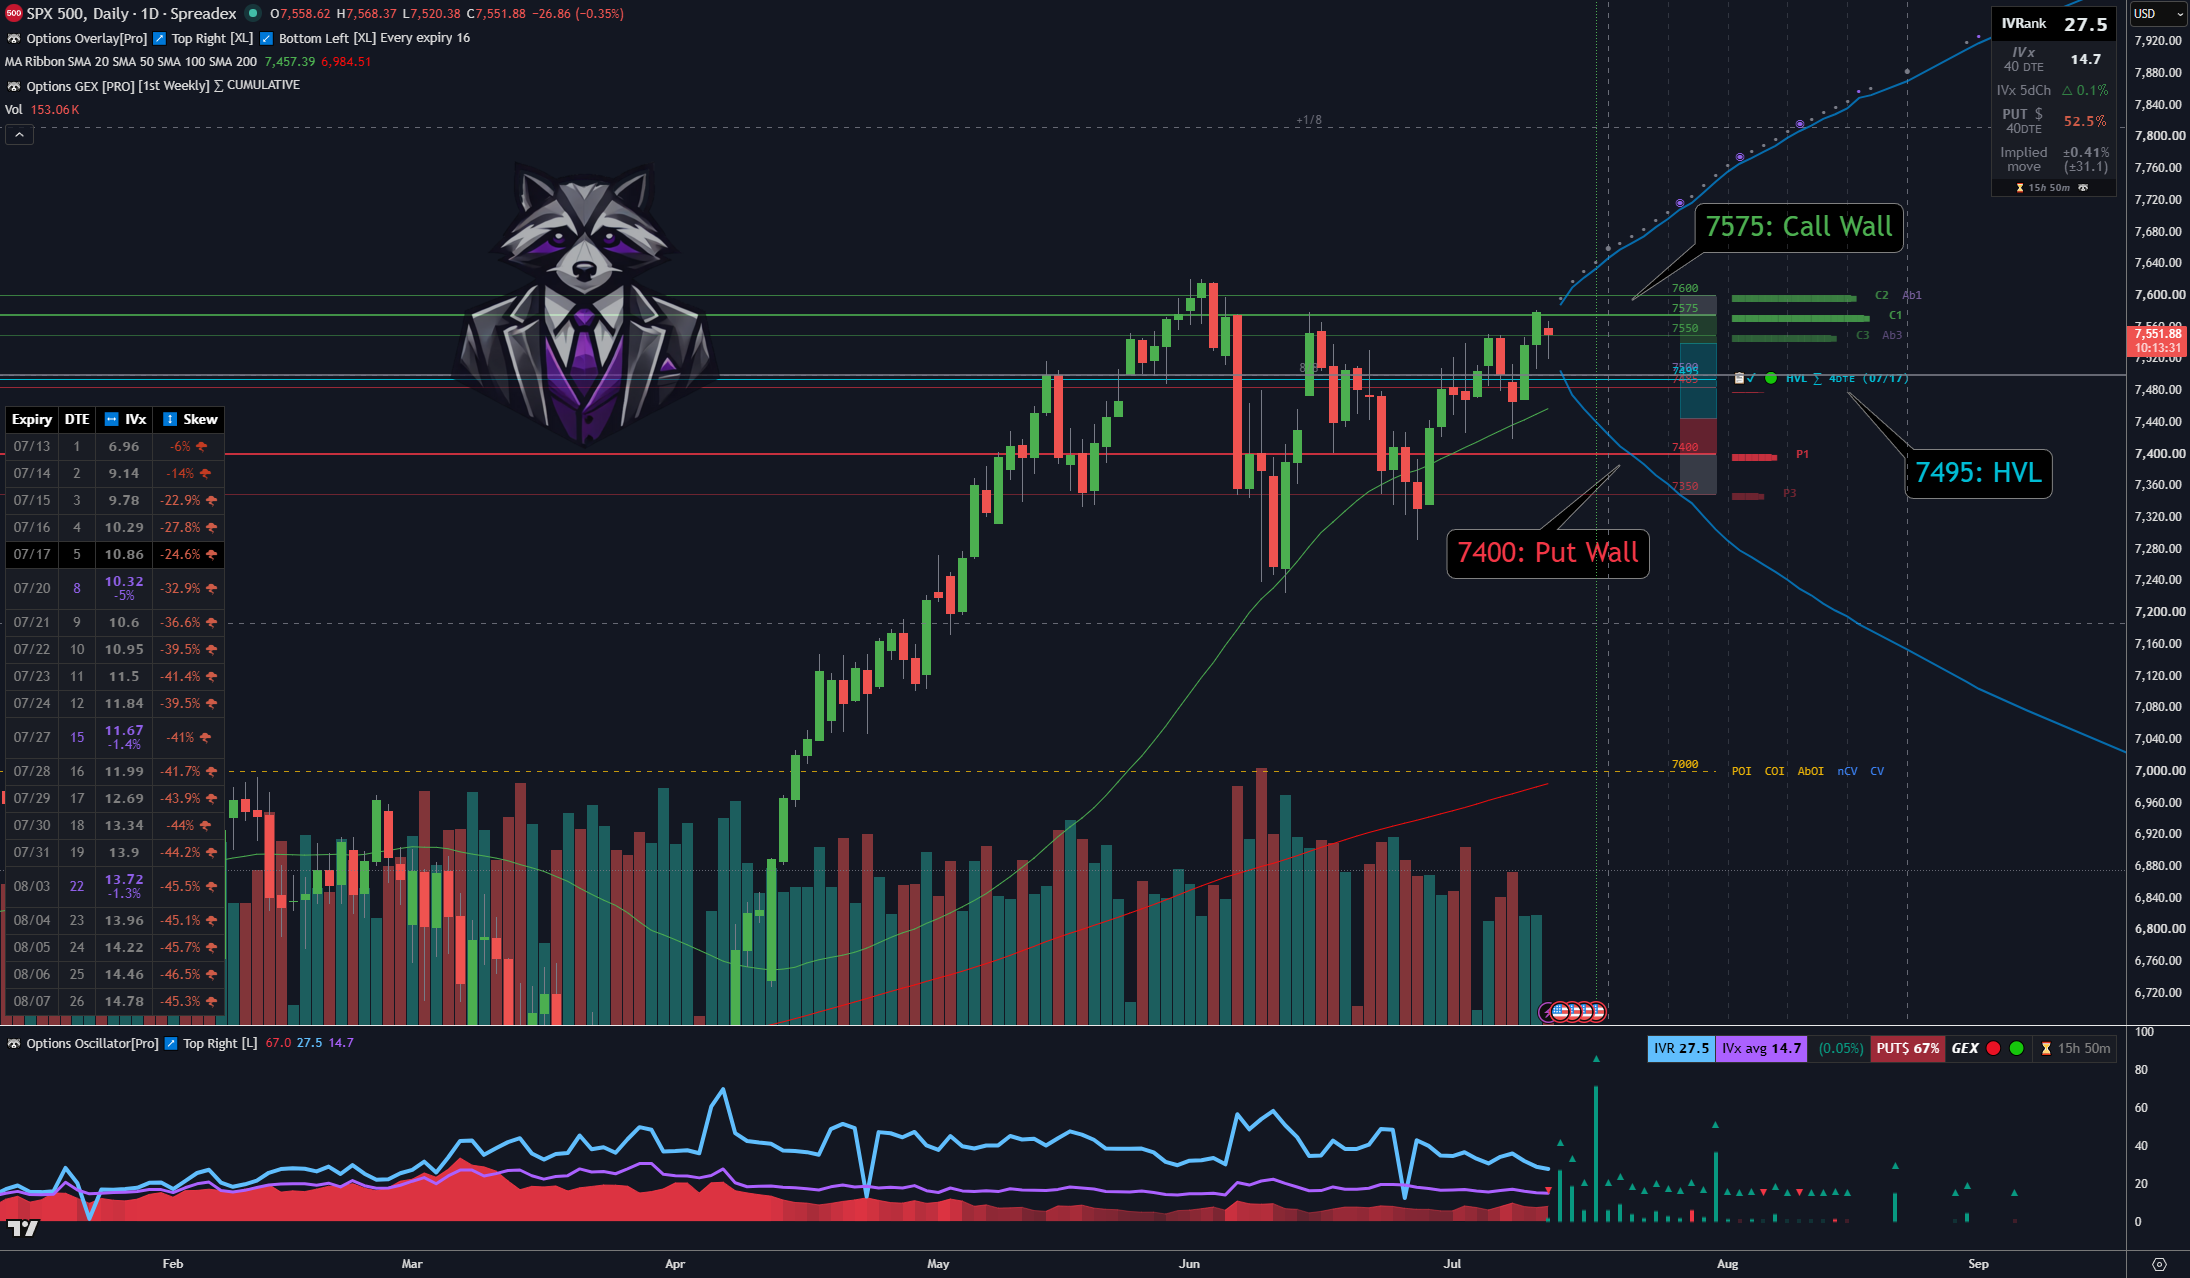
Put skew at 67% is low relative to recent weeks, which fits a tape that has not been paying much for downside protection. That can support a grind while momentum holds; it also leaves less cushion if CPI, bank earnings, or OPEX disappoint.
Key levels from the current structure:
🔵 Regime
7495 — HVL (gamma flip · positive above)
🟢 Call side
7575 — C1 ← nearest overhead
7600 — C2 + Ab1 (absolute GEX hub)
🔴 Put side
7400 — P1
7350 — P2
📊 Options panel
IVRank 27.5 · IVx 14.7 · Put skew 67%
Price pressed toward the upper call stack last week and is now working the zone between HVL and C1. Acceptance above 7575 opens the path toward 7600. Rejection from here would rotate back toward put-side references before the regime line is even tested.
🟢 Upside Scenario — Hold HVL, Accept C1, Test C2/Ab1
The bullish path starts with 7495 HVL holding while spot works the 7575 C1 wall.
In positive gamma, dips toward HVL can still be absorbed if the macro week does not break the surface calm. A daily hold above 7575 C1 would mark short-term acceptance and point the structure toward 7600, where C2 and Ab1 converge into the main overhead GEX cluster.
That is a controlled grind scenario, not a breakout forecast. Dealer positioning can slow reactions above HVL, but a crowded call stack at 7600 can still cap or stall the first extension attempt.
🔴 Downside Scenario — C1 Rejection Toward Put Cluster
The bearish path begins with failure at the 7575–7600 call zone or a slip back through 7495 HVL.
A rejection at C1 without same-day recovery would shift focus toward 7400 P1 as the first major put reference.
A close below 7495 HVL would change the environment. Below the gamma flip, moves can widen and downside responses can accelerate into 7400 P1 and 7350 P2.
The downside map is:
First warning: fail 7575 C1 / stall under 7600 C2/Ab1
First put reference: 7400 P1
Regime line: 7495 HVL
Below HVL: structure becomes more fragile; 7350 P2 is the next put-side reference
🔹 What the Current Structure Tells Us
SPX is constructive above HVL but is already pressing into overhead structure. The index is pressing call-side structure into CPI, bank earnings, and monthly OPEX with thin put skew underneath.
The key level is 7495 HVL.
Above it, the market can still grind toward 7600 if 7575 C1 accepts.
Below it, the same macro week can produce faster downside responses toward 7400 P1.
🔶 Macro Calendar and Earnings
Tuesday through Friday runs data and corporates back to back.
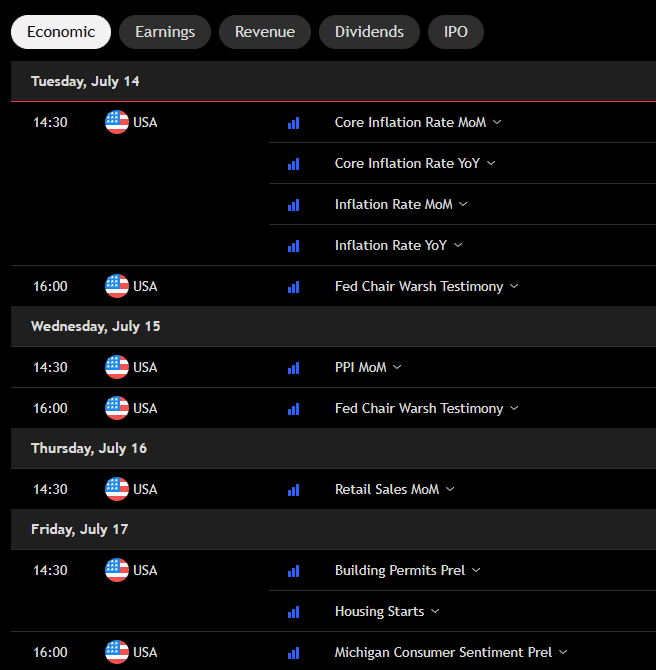
CPI (Tuesday), PPI (Wednesday), and retail sales (Thursday) land ahead of and alongside Q2 earnings kickoff. JP Morgan, Bank of America, Goldman Sachs, Wells Fargo, Citigroup, and Morgan Stanley report in the first bank wave. Johnson & Johnson, UnitedHealth, Intuitive Surgical, ASML, and Netflix add healthcare, equipment, and consumer-tech reads. Netflix has been weak into its print even on firm index days.
🔶 What We Are Watching
🏛️ Policy & macro
· CPI — Tuesday
· PPI — Wednesday
· Retail sales — Thursday
📉 Vol & rates
· VIX — expand into CPI or hold compressed?
· Oil — Iran follow-through
📊 Earnings
· Banks — JPM, BAC, GS, WFC, C, MS
· Healthcare — JNJ, UNH, ISRG
· Tech — ASML, NFLX
🏗️ Structure
· SPX vs Nasdaq spread — breadth hold if XLK stays soft?
· Nasdaq downtrend line — daily close above resistance?
· SMH / memory — stabilization or continued drag?
🌊 Flows
· Sector rotation — financials in, XLK lagging: pause or persist?
🔶 The Tanuki Angle
That split between the broad benchmark and the Nasdaq-heavy book is rotation, not collapse. Structure and sector exposure count as much as which index printed green.
With premiums already compressed ahead of a four-day event stack, the tape can grind higher on momentum alone. It can also reprice fast on the first print that disagrees with the calm surface.
A crowded calendar does not require a prediction before the first release. Let price react, then decide whether the market still supports the same plan.
Good process means updating the plan as new information arrives, instead of defending a view formed before the week began.
GEX is not a crystal ball. HVL is not a mechanical trigger. A call wall is not a guaranteed top, and a put wall is not a guaranteed bottom. The value comes from reading the environment before choosing a structure.
🔶 Case Study — COIN Bullish Butterfly Financed at P1
Structure and adjustments drove this trade, not a directional call on crypto.
For the June 18 expiry, COIN was bouncing from P1 (the largest put wall) and holding near HVL while call volume ran heavier than puts. The setup targeted 180, just inside the adaptive expected-move upper bound near 185. The structure paired a 180 bullish butterfly with a short put at P1 to finance the debit and collect theta if price moved sideways.
The position was opened cash-secured. Upside needed price to firm; neutral drift still paid as time decay worked. The main loss zone sat below 150.
After a rally into 170 C1 (highest call GEX), the first adjustment bought back the short put leg for $0.45, banking roughly $240 and capping downside risk near $20 on the remaining butterfly. Half the butterfly was scaled out on June 16 for a $2.10 credit versus a $1.30 entry. With only two days left, price stalled at C1 for three sessions, theta was turning negative, and FOMC added gap risk. The remaining half closed June 17 at the same $2.10 credit. Total profit: $400.
The lesson is process at walls: P1 financed the entry, C1 defined when to stop waiting for continuation. With limited DTE, locking gains beat debating whether 170 would break on the fourth attempt.
Full step-by-step breakdown, including adjustment screenshots and live GEX reads, in this week’s video:
⚠️ Trade with flat-delta, high risk-reward structures, keep your positioning adaptable, and always monitor the GEX levels and the surrounding gamma environment — they’ll tell you more about the path ahead than the headlines ever will!
You can find additional valuable content on our YouTube channel, and if you feel like trying out our
⭐ GEX-Live Charting View, you can do so with a 7-day free trial here: ⭐
https://tanukitrade.com/
This material is for educational purposes only; TanukiTrade is not a financial advisor, and nothing here constitutes investment advice or a recommendation.