
09/02 DEX and GEX in 0DTE SPX – with Practical Examples - Part 1
(Part 1 – TanukiTrade DEX with examples Educational Series)

The summer break did me good as well — it gave me time to clear my head and reflect on the hundreds of client requests you’ve sent me about TanukiTrade. 😊
From your feedback, I see that many of you want to understand better the data shown by the TanukiTrade Discord PRO GEX Bot. That’s why today’s material is more educational — in fact, it’s a two-part series:
👉 We’ll dive into the relationship between DEX and GEX, especially in the context of 0DTE SPX options, blending theory with my practical trading experience.
To help you follow along, I’ve decided that every day after market close we’ll post an animated recap of intraday 0DTE SPX DEX + GEX changes for PRO subscribers on Discord. (I’ll post the exact link on Discord today once I’m done with it.)
These videos will be published after market close, built from the images you already know from our minute-by-minute Live GEX feed channel.
A feature is worthless if you don’t know how to use it. So let’s take a look at it…
What will you learn in this series?
What is DEX and how do we calculate it?
How to read the DEX + GEX charts together?
When can you trade with more confidence based on these signals, and when should you be cautious (noisy vs. clean roadmap)?
Basic Concepts – GEX and DEX in Brief
Gamma Exposure (GEX)
GEX is more widely known. Think of it as a map or compass: it shows you the important reaction zones from the market maker’s perspective.
Not a directional indicator.
It highlights where and how intensely market makers will need to adjust their deltas.
As a forecast, the GEX profile shows which price levels cause relatively stronger hedging pressure.
Gamma has a bell-curve shape when viewed on a single strike:
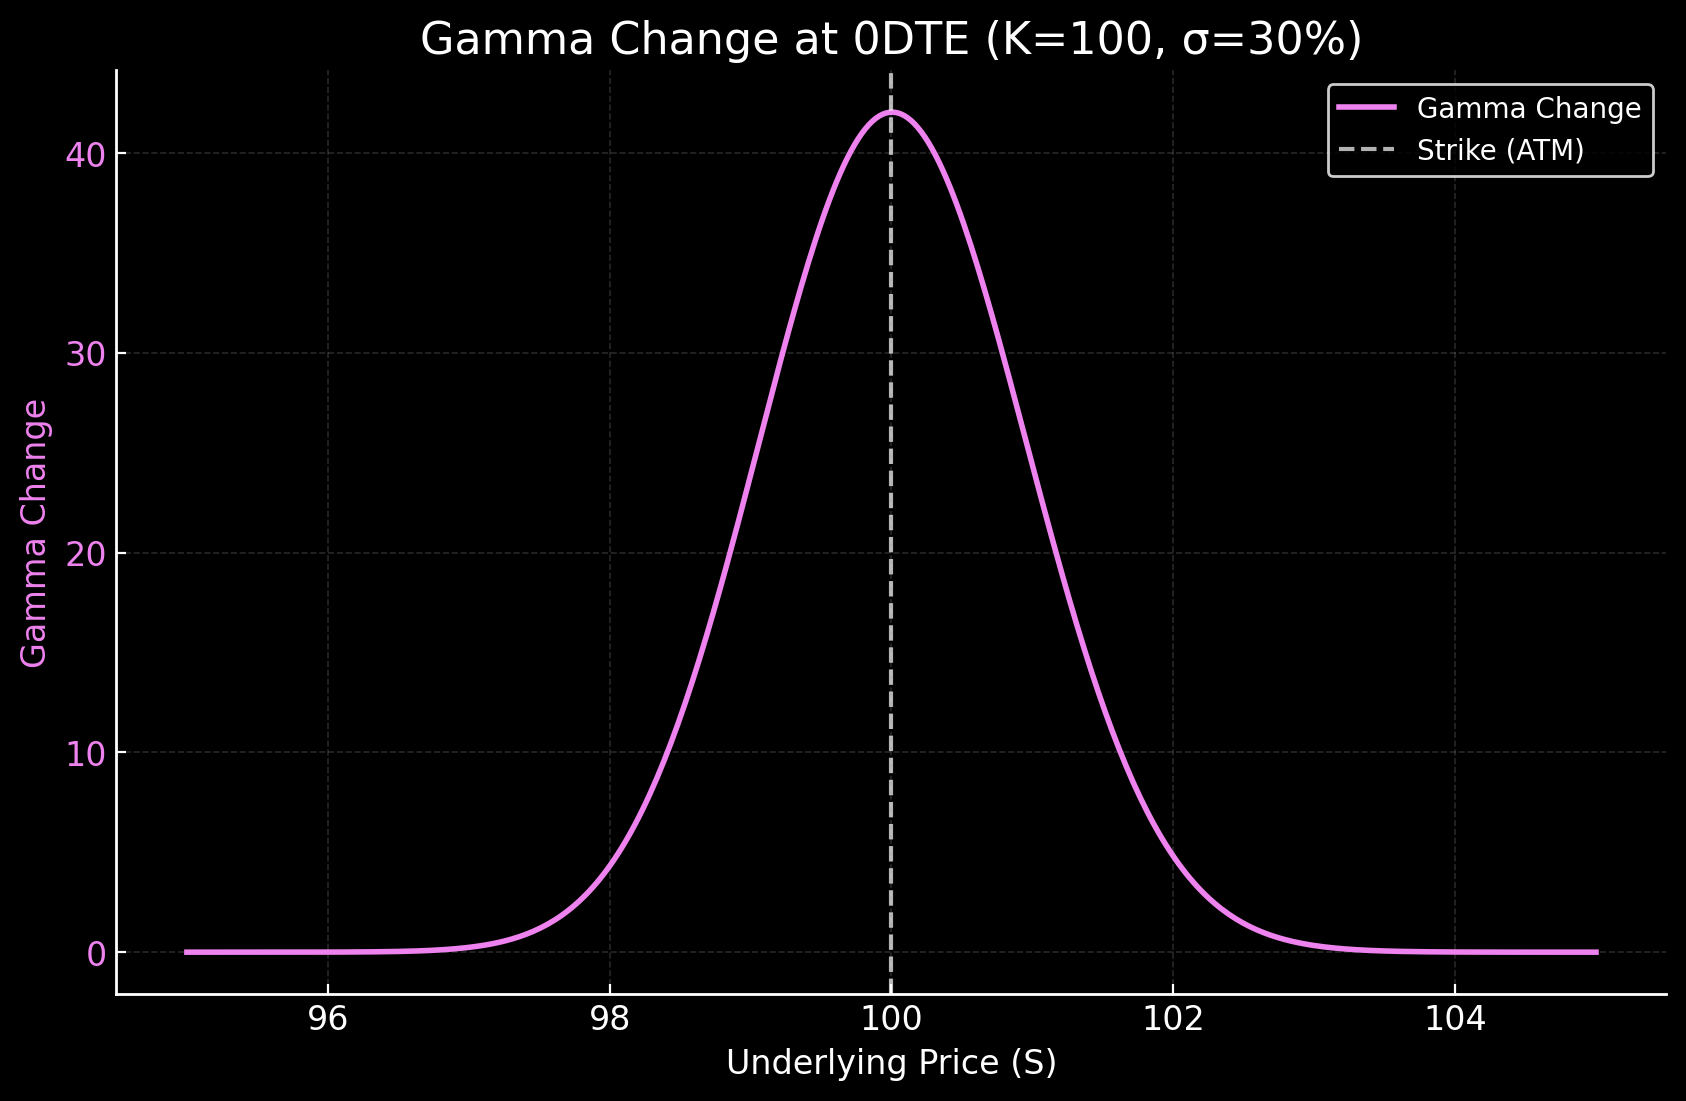
Gamma (purple) spikes sharply at the ATM strike → meaning hedging needs are most sensitive there.
At TanukiTrade we offer
A TradingView GEX indicator (I’ve written a lot about how to use this over the past year):
A Discord bot visualization, updating every minute for SPX 0DTE
What we’re writing about for the first time—and what will now be the focus—is DEX (Delta Exposure).
DEX (Delta Exposure) is like a “fuel gauge” that shows the overall directional exposure and which way it’s pointing. Keep in mind: dealers (market makers) don’t profit from directional bets—they aim to stay delta neutral. So if things tilt too far one way, breaking their standard neutralization efforts, they must act!
🟢 Positive DEX → The dealer’s (market maker’s) book overall has a positive delta (long exposure). Their goal is to reduce that positive delta, so their behavior is driven by this ambition. They need to reduce delta! (e.g., sell the underlying, write calls, or buy puts).
🔴 Negative DEX → The dealer’s book overall has a negative delta (short exposure). The larger this negative exposure is at a given strike, the worse it is for them—they need to move toward a relatively lower-exposure level. That level could be either down or up! (That’s why in a negative GEX environment, market makers often move in the same direction as retail flows—they’re searching for a smaller negative-exposure zone, whether above or below price → this sets the stage for a negative gamma squeeze once price breaks under put support).
Because of the above, DEX is merely a snapshot of the current exposure – it can change minute by minute (and especially with 0DTE… it does change!)
It’s important to interpret the entire DEX structure (since the dealer’s goal is to move = delta-neutralize). For DEX we don’t just look at one level in isolation; just like with GEX, we consider the whole structure.
👉 In general, DEX fills GEX with a more directional hedging necessity: it provides a better probability field for the likely direction if price arrives at that level.
Look at the simplified chart for Delta changes around ATM:
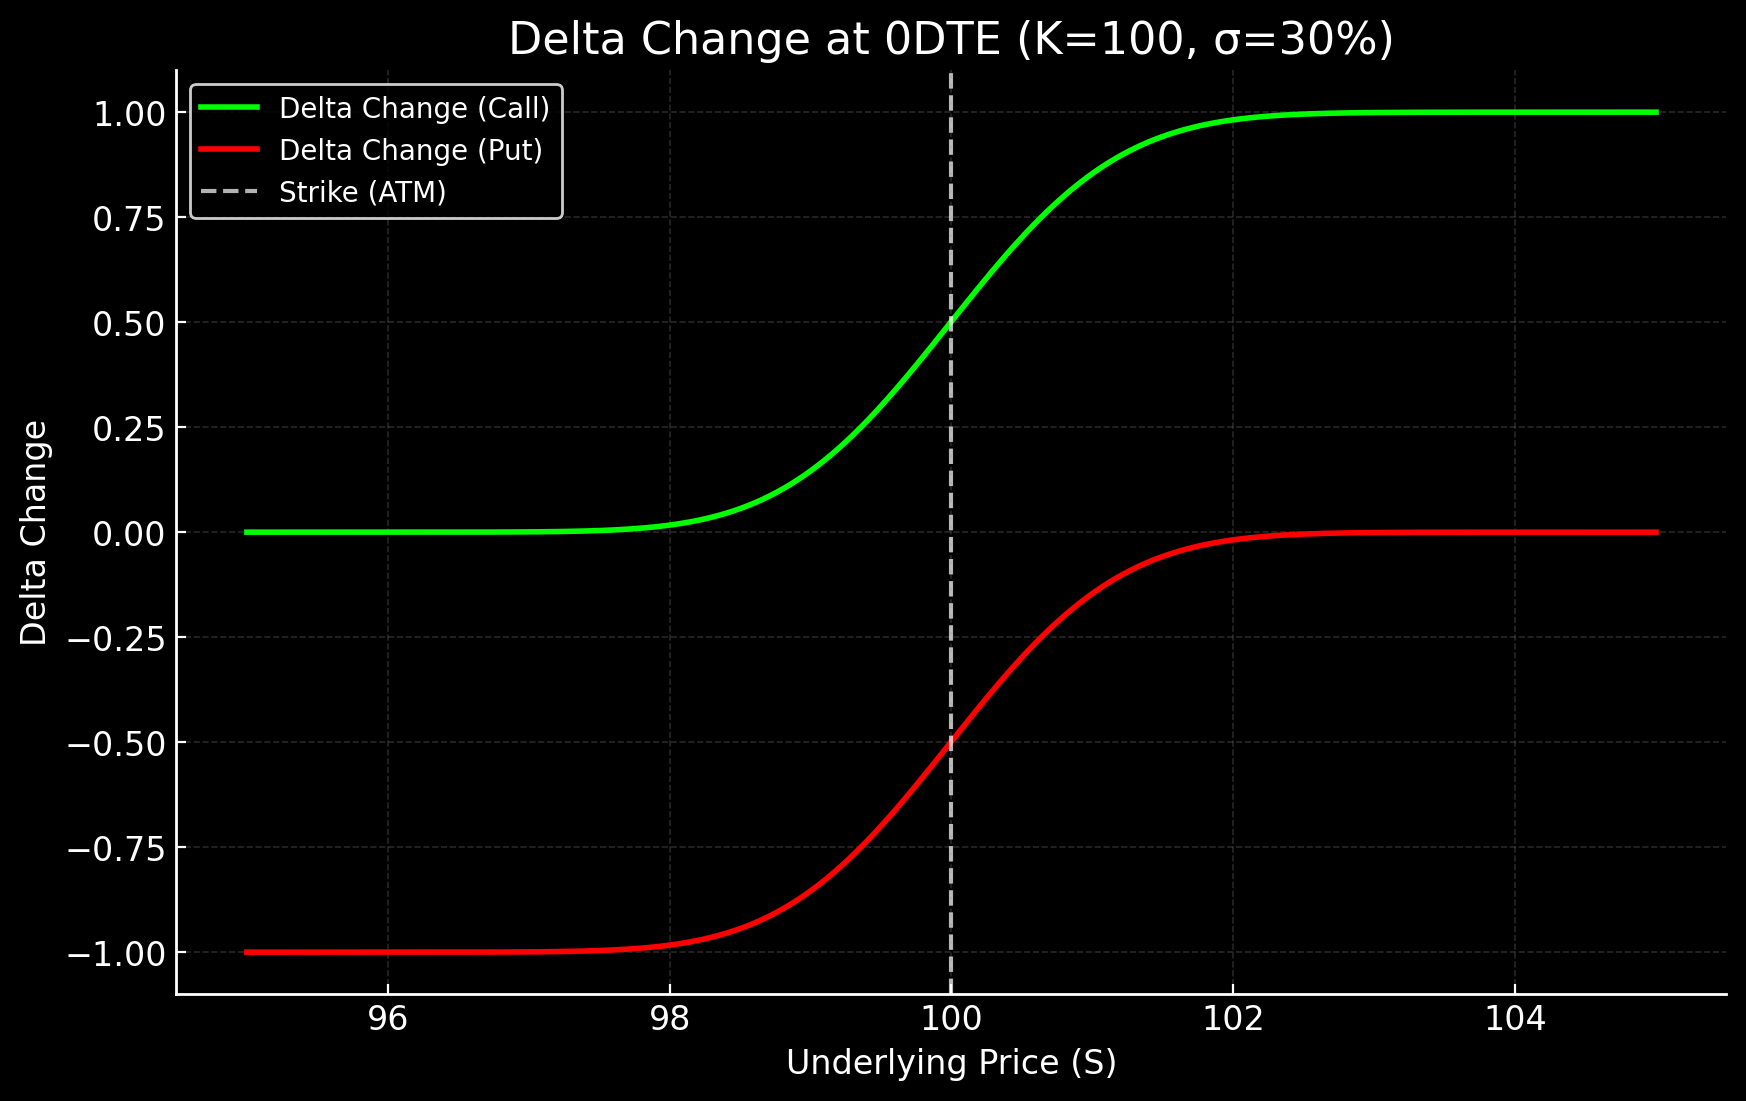
DEX Call (green) and DEX Put (red) curves represent delta exposure.
They shift dramatically between –1 → +1, and at 0DTE this transition is very steep.
But don’t forget: the dealer does not move the market; they only react.
The dealer doesn’t initiate direction but responds to market moves.
Their reaction, however, can trigger short-term moves in size.
This is why they must constantly build what/if scenarios throughout the day, second by second, to preserve liquidity and reduce exposure. Tough job!
There’s no DEX indicator on TradingView. If you want to see deeper into this directional radar that Delta Exposure represents, you need to dig further. The good news: you can use our GEX Bot visualizations on our Discord (that’s actually why I developed the side bot).
Why Don’t We Use DEX as the Primary Indicator?
A fair question:
“Greg, if DEX shows direction, why do you only show GEX in TanukiTrade?”
Mainly because:
DEX shows instantaneous directional exposure, but by itself (a single strike) it doesn’t indicate how price movement will likely force dealers to adjust further.
DEX is what matters in that exact moment. But… because Delta is extremely theta-sensitive via gamma, it can shift quickly.
If price doesn’t move, Net OI doesn’t move (static from premarket), and GEX doesn’t move much (just narrows slightly around spot)…
…yet DEX in 0DTE can change dramatically within even 1 hour – both its magnitude and its direction!
GEX, on the other hand, better shows where significant DEX hedging stress is likely to occur. That makes it more directly useful for identifying trading key levels, since it highlights not only the “now,” but also the next reaction zones ahead.
👉 In short: GEX gives us the high level big picture.
OI, GEX, and DEX Compared
Let’s take a closer look by comparing the 3 main components that matter. Simply put, if I want to project it onto 0DTE SPX options:
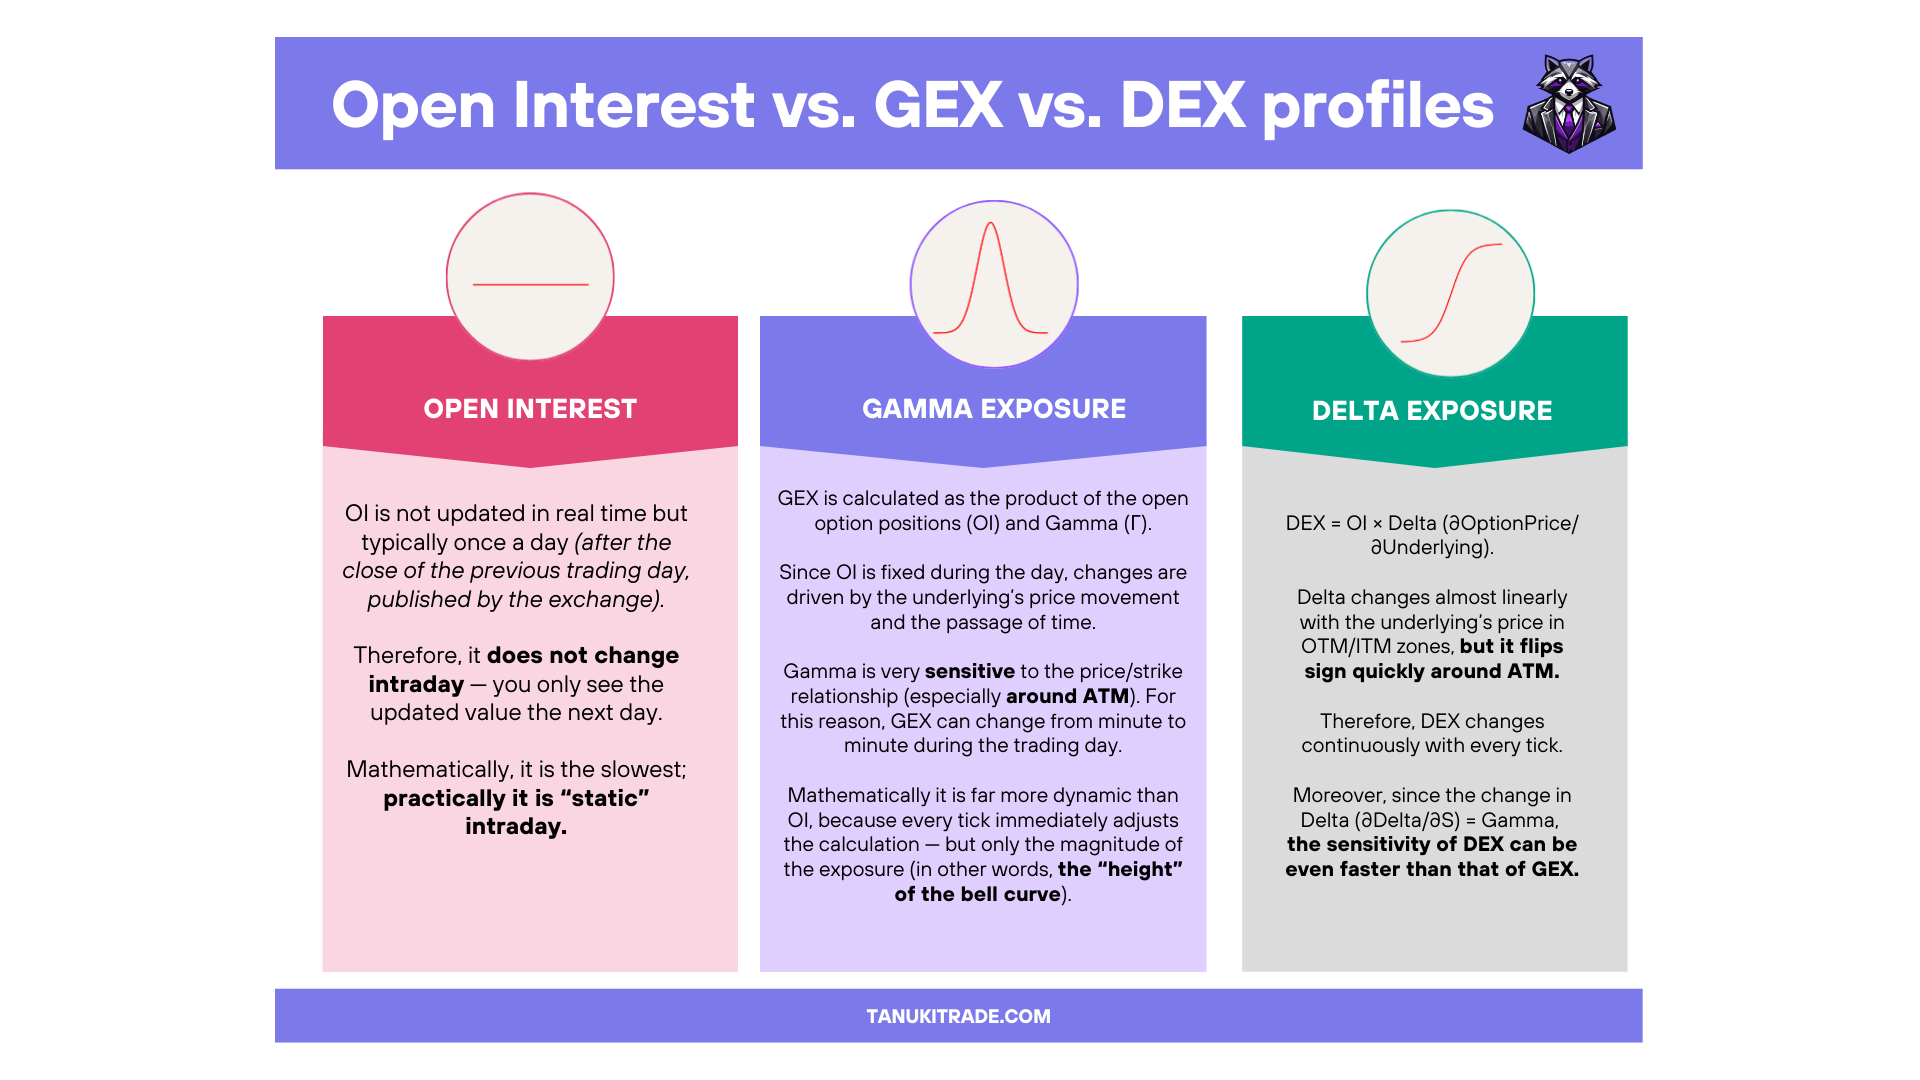
🔶 Net OI = the static component for the day, after the Clearing House publishes it premarket. (Net OI = Call OI – Put OI).
Many try to build “dynamic/fake OI” from volume and other intraday data — this is misleading and only an approximation. Only market makers see true intraday OI. Fun fact: I’ve never seen a trader profit just from synthetic OI.
CBOE Open-Close Volume Summary a useful add-on that helps bridge volume and OI. Can show nuances of order flow (who opened, who closed, in what direction). But it does not replace real intraday OI.—
🔶 GEX = a map of expected hedging flows and the most important hedge levels during the day.
More stable; reacts mainly to spot movement.
In simple terms: Net OI weighted by gamma and scaled by time-to-expiry.
Gamma = first derivative of Delta → GEX shows where the dealer must hedge.
🔶 DEX = snapshot of “who’s leaning where” right now.
At ATM it flips sign depending on call/put dominance (0 → 1, –1 → 0).
At each strike, DEX pulses and shifts with time and spot (theta effects, especially at 0DTE).
This means a DEX profile bar seen in the morning tells you nothing about later in the day on its own.
Only when read together with GEX does it become meaningful.
Think of DEX as a scale that keeps tilting with time + spot, depending on call/put dominance at each strike.
👉 So DEX shows how intensely dealers need to hedge and in which direction, building what-if scenarios as price evolves.
GEX = map of broad reaction zones.
DEX = how much “fuel” is behind the move when we get there, from the dealer’s perspective.
Together, they tell you:
Where the key levels are (GEX levels, we already know them).
How strong the hedging push might be if price reaches them (DEX).
What to expect if price bounces off a level vs. breaks through (what-if scenarios you learn to build with practice).
Practical View
When we approach a GEX reaction zone:
Watch DEX.
Watch it even if price isn’t moving — it may still change.
This is only a taste in this first part. In the continuation of the series, we’ll go deeper into many, real examples!
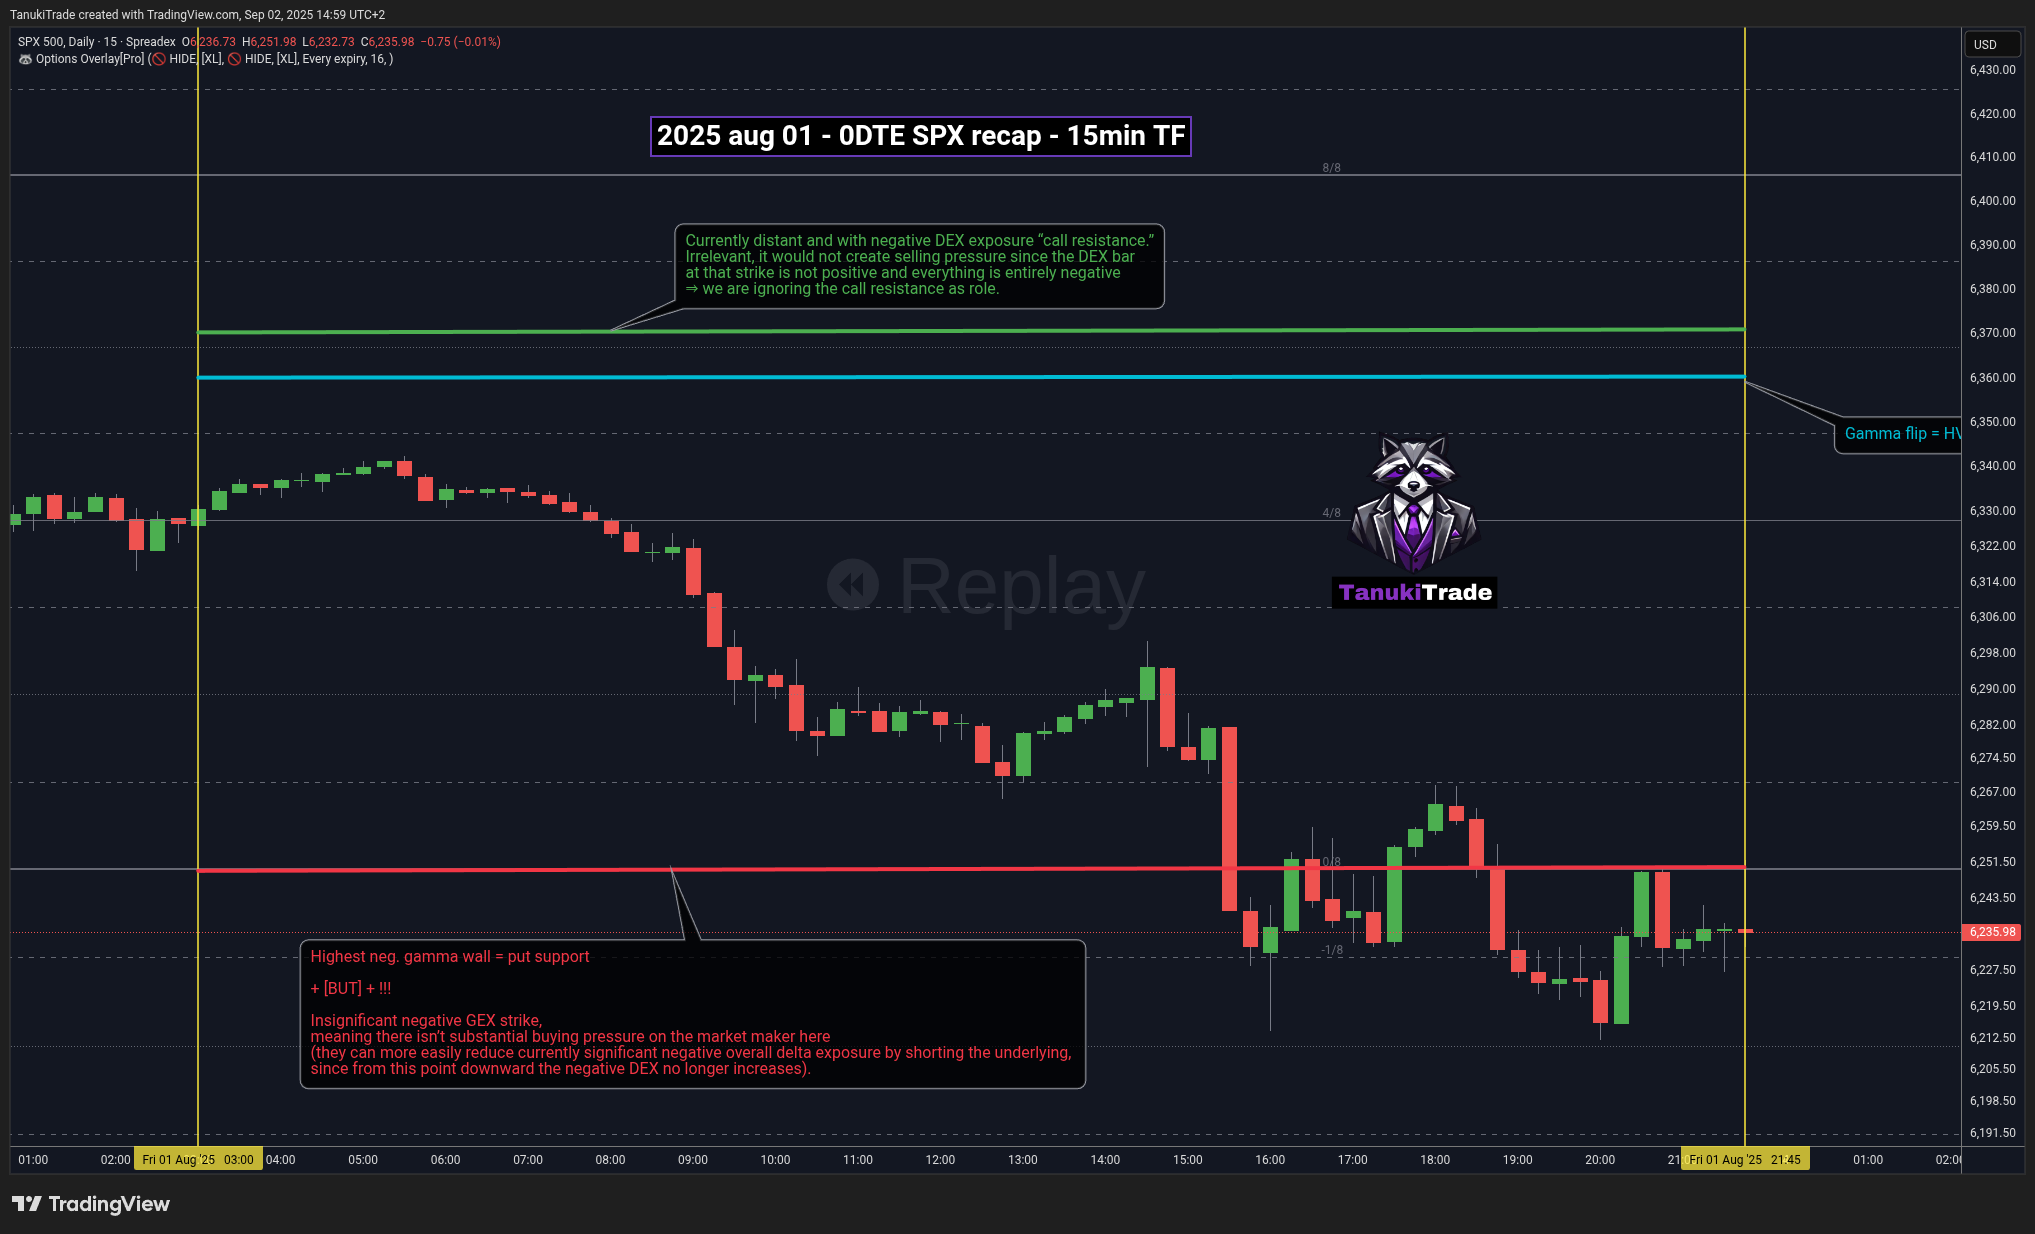
Example Scenario A (2025-08-01, premarket): Significant GEX strike, but with low DEX compared to the other strikes
In the video below you can see the 2025-08-01 0DTE,
But the essence of the premarket is frozen:
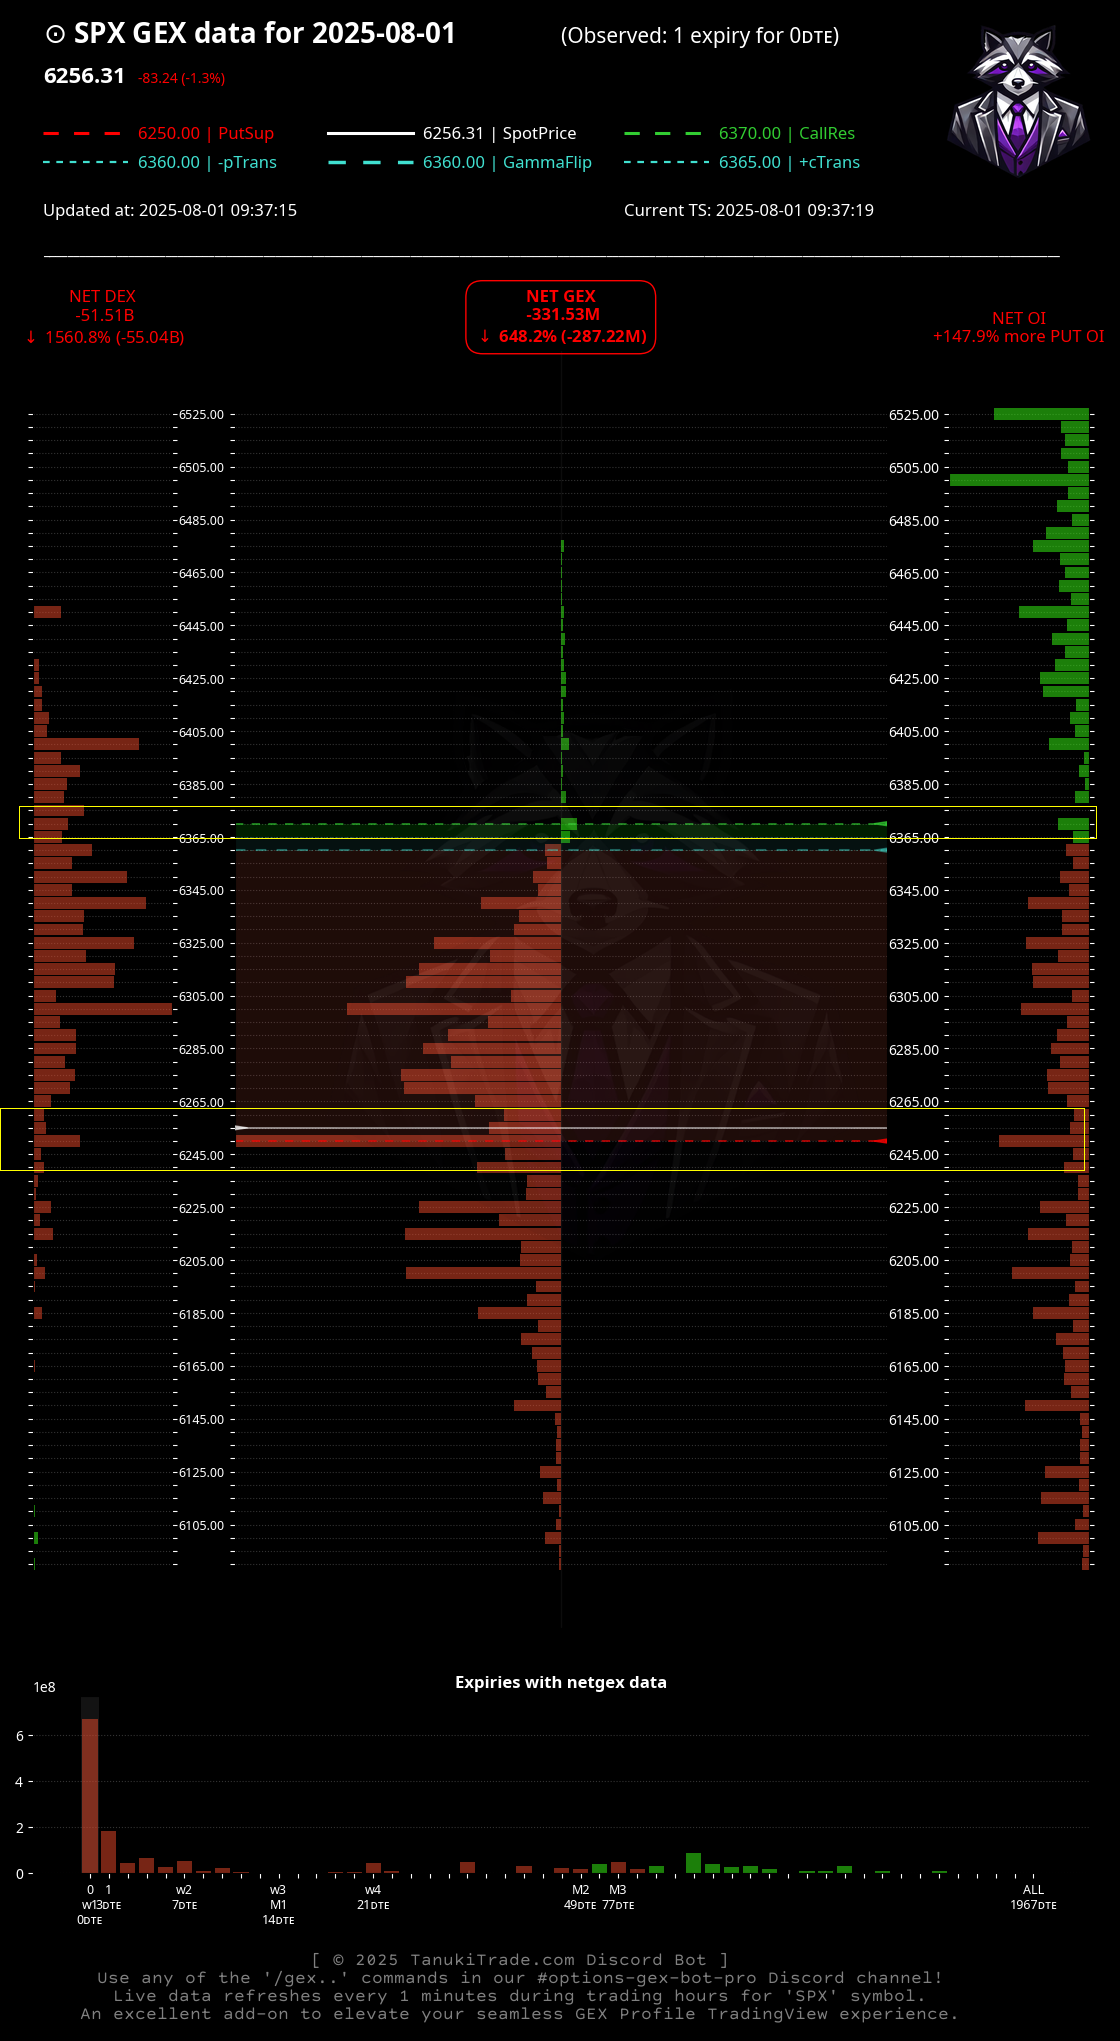
Distant call resistance with negative DEX exposure
Irrelevant: no selling pressure.
DEX bar not positive, overall negative.
⇒ Ignore this level.
Highest negative gamma wall = Put Support
Key level for likely buying pressure.
BUT (and this is important!) insignificant negative DEX strike
Not enough to create dealer buying pressure.
Easier for them to short underlying to reduce negative delta.
Below here, negative DEX no longer increases.
Result: the largest negative GEX wall does not behave as a strong put support.
And now let’s look at the explanation on the chart:
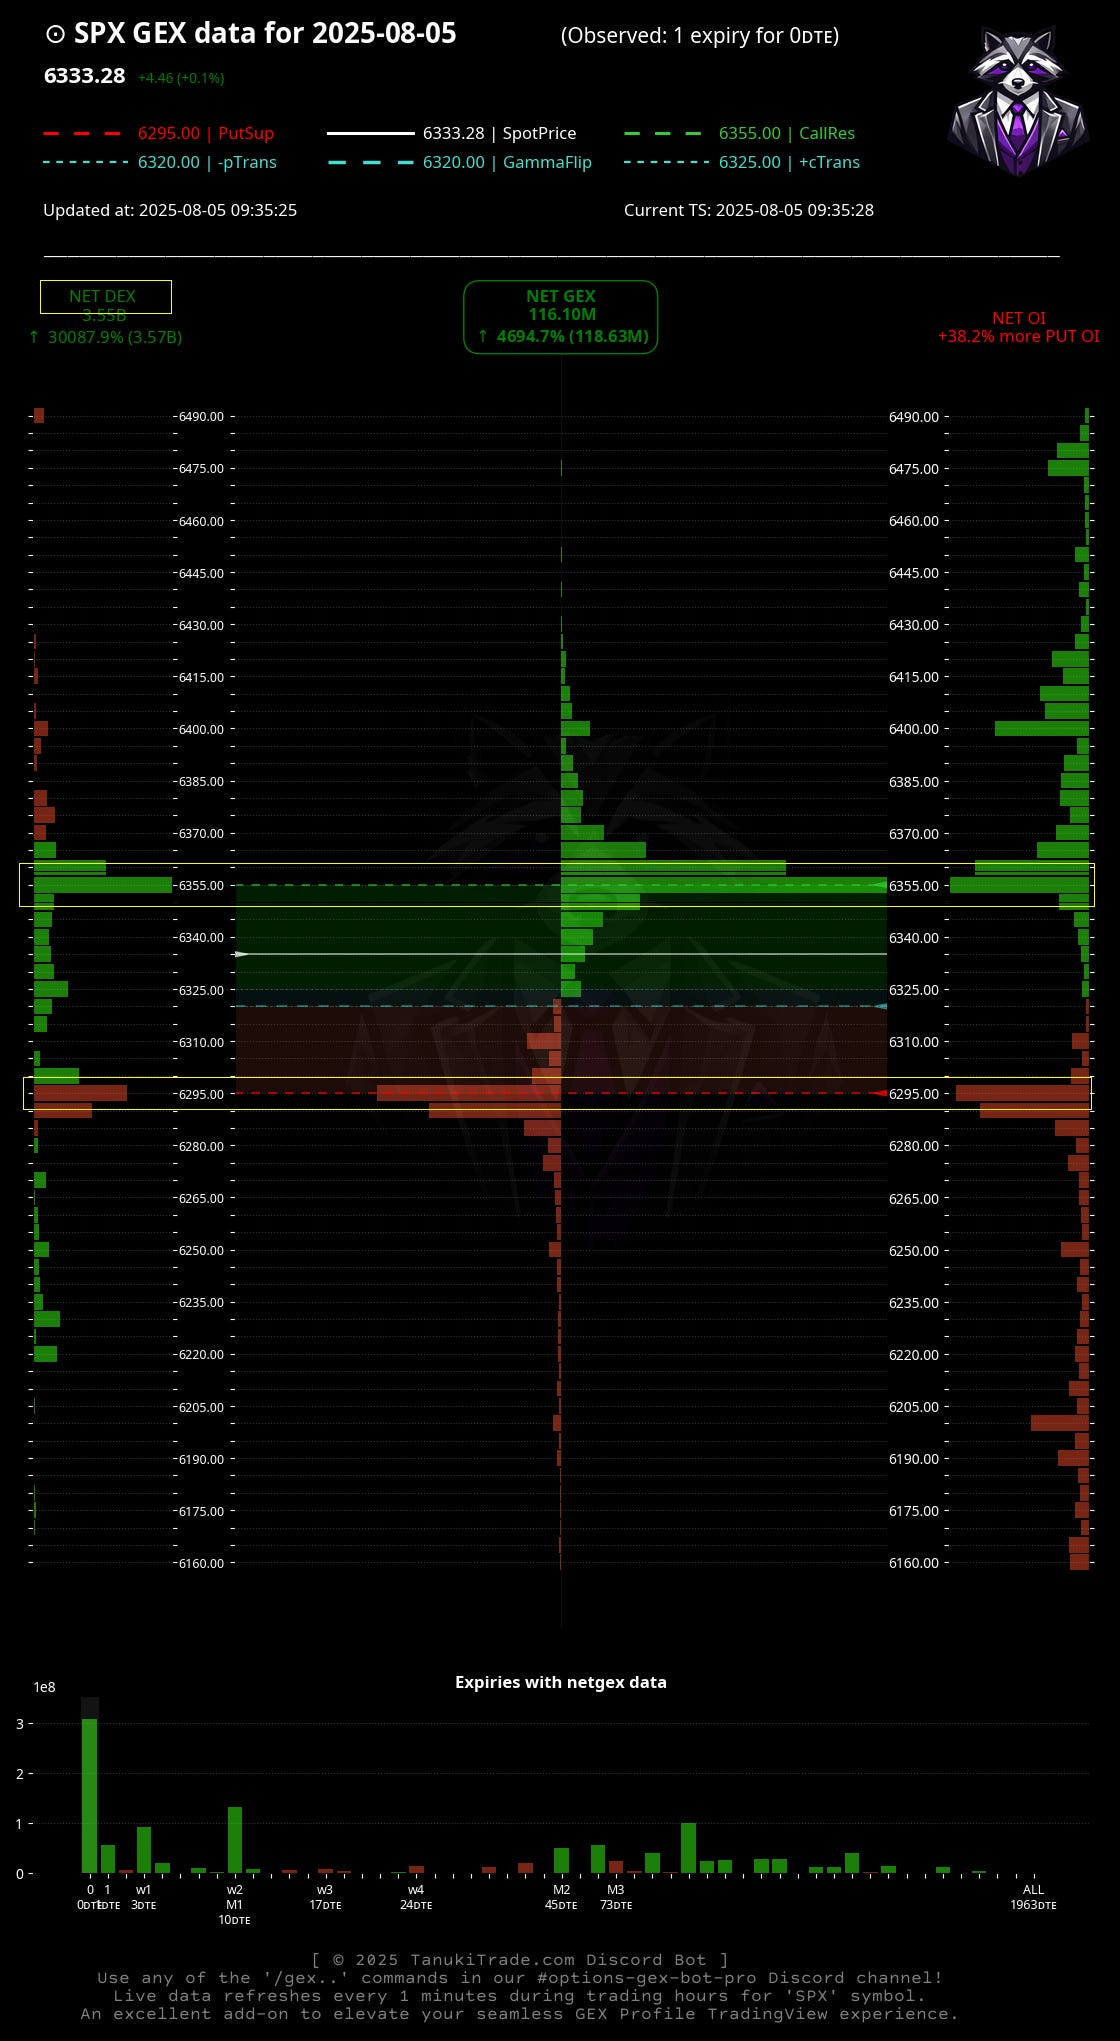
Example Scenario B (2025-08-05, at open)
Significant GEX level, but DEX is also massive compared to the other expirations:
In the video below you can see the 2025-08-05 0DTE,
The essence of the market-open is frozen:
And now let’s look at the explanation on the chart:
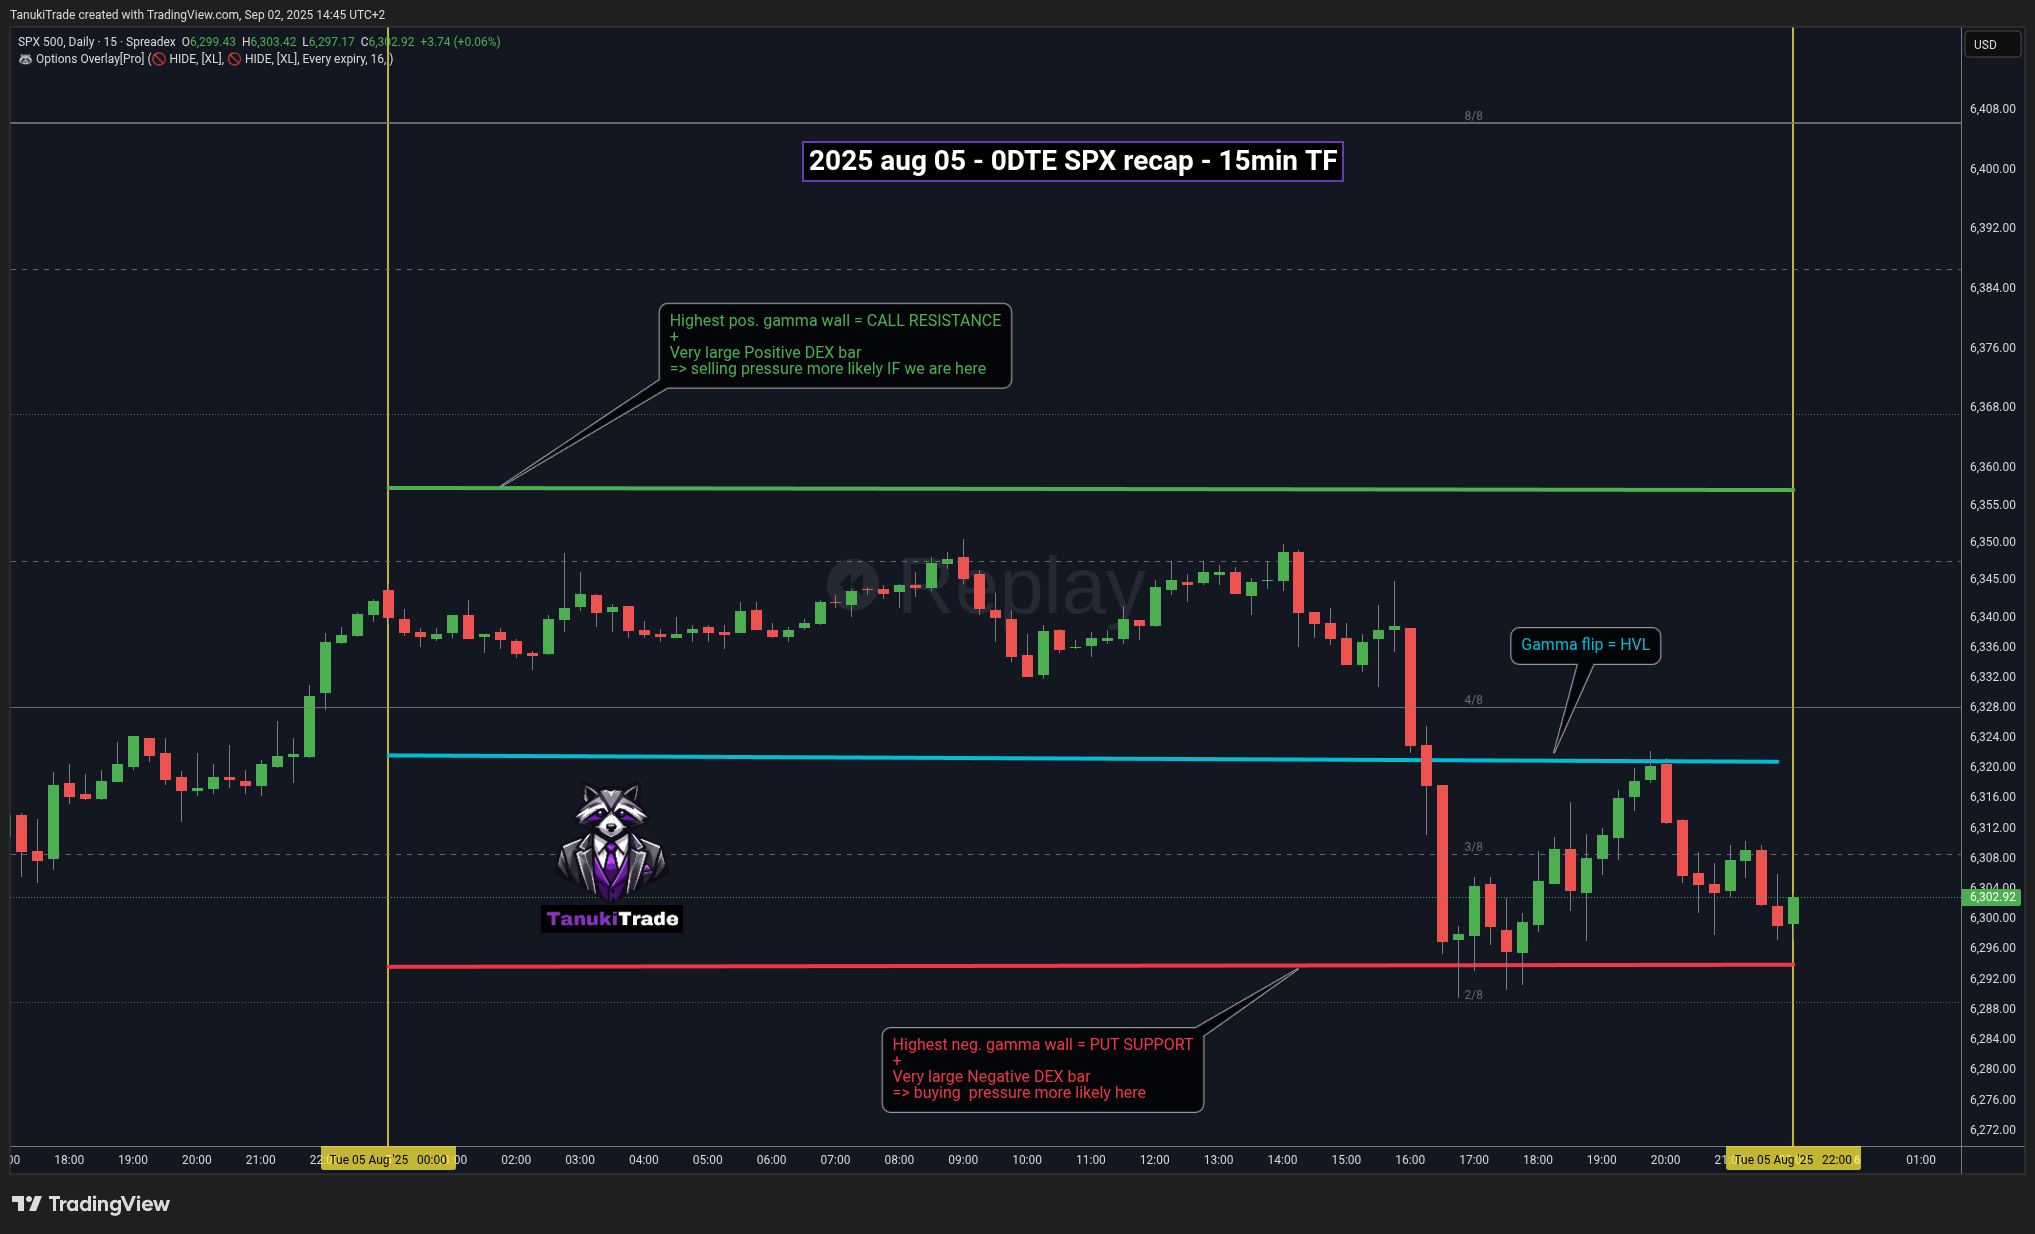
Dealers see too much exposure at a strike → they want to move away to a lower-risk level.
Rule of thumb:
At significant positive DEX strikes → dealers sell.
At significant negative DEX + GEX strikes → dealers buy.
Thus the classic Call Resistance / Put Support role works well!
Highest positive gamma wall = Call Resistance
Combined with Large positive DEX bar → Selling pressure more likely if price is here.
Highest negative gamma wall = Put Support
Combined with Large negative DEX bar → Buying pressure more likely here.
Conclusion:
No single number or colored bar defines a full strategy.
DEX and GEX are valuable individually, but together they form the complete picture.
On TradingView, since DEX cannot realistically be shown intraday with correct sign and magnitude, we visualize GEX.
For deeper insight, check DEX real-time visualizations on our Discord.
The key is understanding the structure as a whole:
GEX → the map (key zones, hedging pressure forecast).
DEX → the fuel (intensity and direction at specific strikes, relative to neighbors).
That’s why we rely on both: TradingView indicators for the broad map, and Discord bots for the detailed real-time profile.
What’s Next
In the next part, I’ll show practical 0DTE SPX examples with videos on how to use these visualizations effectively within the TanukiTrade ecosystem.
You’ll learn:
When the picture is too noisy → when not to rely on GEX + DEX (unless you’re gambling).
How to use probabilities to your advantage.
How to read the dealer’s playbook each morning at a glance via our GEX profile visualizations.
⭐ Rate Us on Trustindex!
We’re just a few reviews away from earning our "Trusted Business" badge!

If TanukiTrade has helped you—through the tools, community, or support—
please take just 1 minute to leave a review. It means a lot to us.
Very good information on a complex to understand topics...Thanks.
excellent