


10/14 SPX & QQQ: Options Market Shifts and Volatility Clues
SPX & QQQ are nearing a crucial resistance point—will time spreads be the play of the week? Every week we review everything you need to know about the options market for the week ahead.

I was able to take full advantage of what I mentioned in last week’s newsletter. I opened a double SPX call diagonal, which I closed after three days with a nice $329 profit. For those interested in more details, I’ve shared my trade journal entry on Reddit.
Now, let's look at the SPX & QQQ weekly options market analysis (based on data before Monday's opening):
SPX Weekly GEX and option chain analysis
Breakout and Bullish Outlook
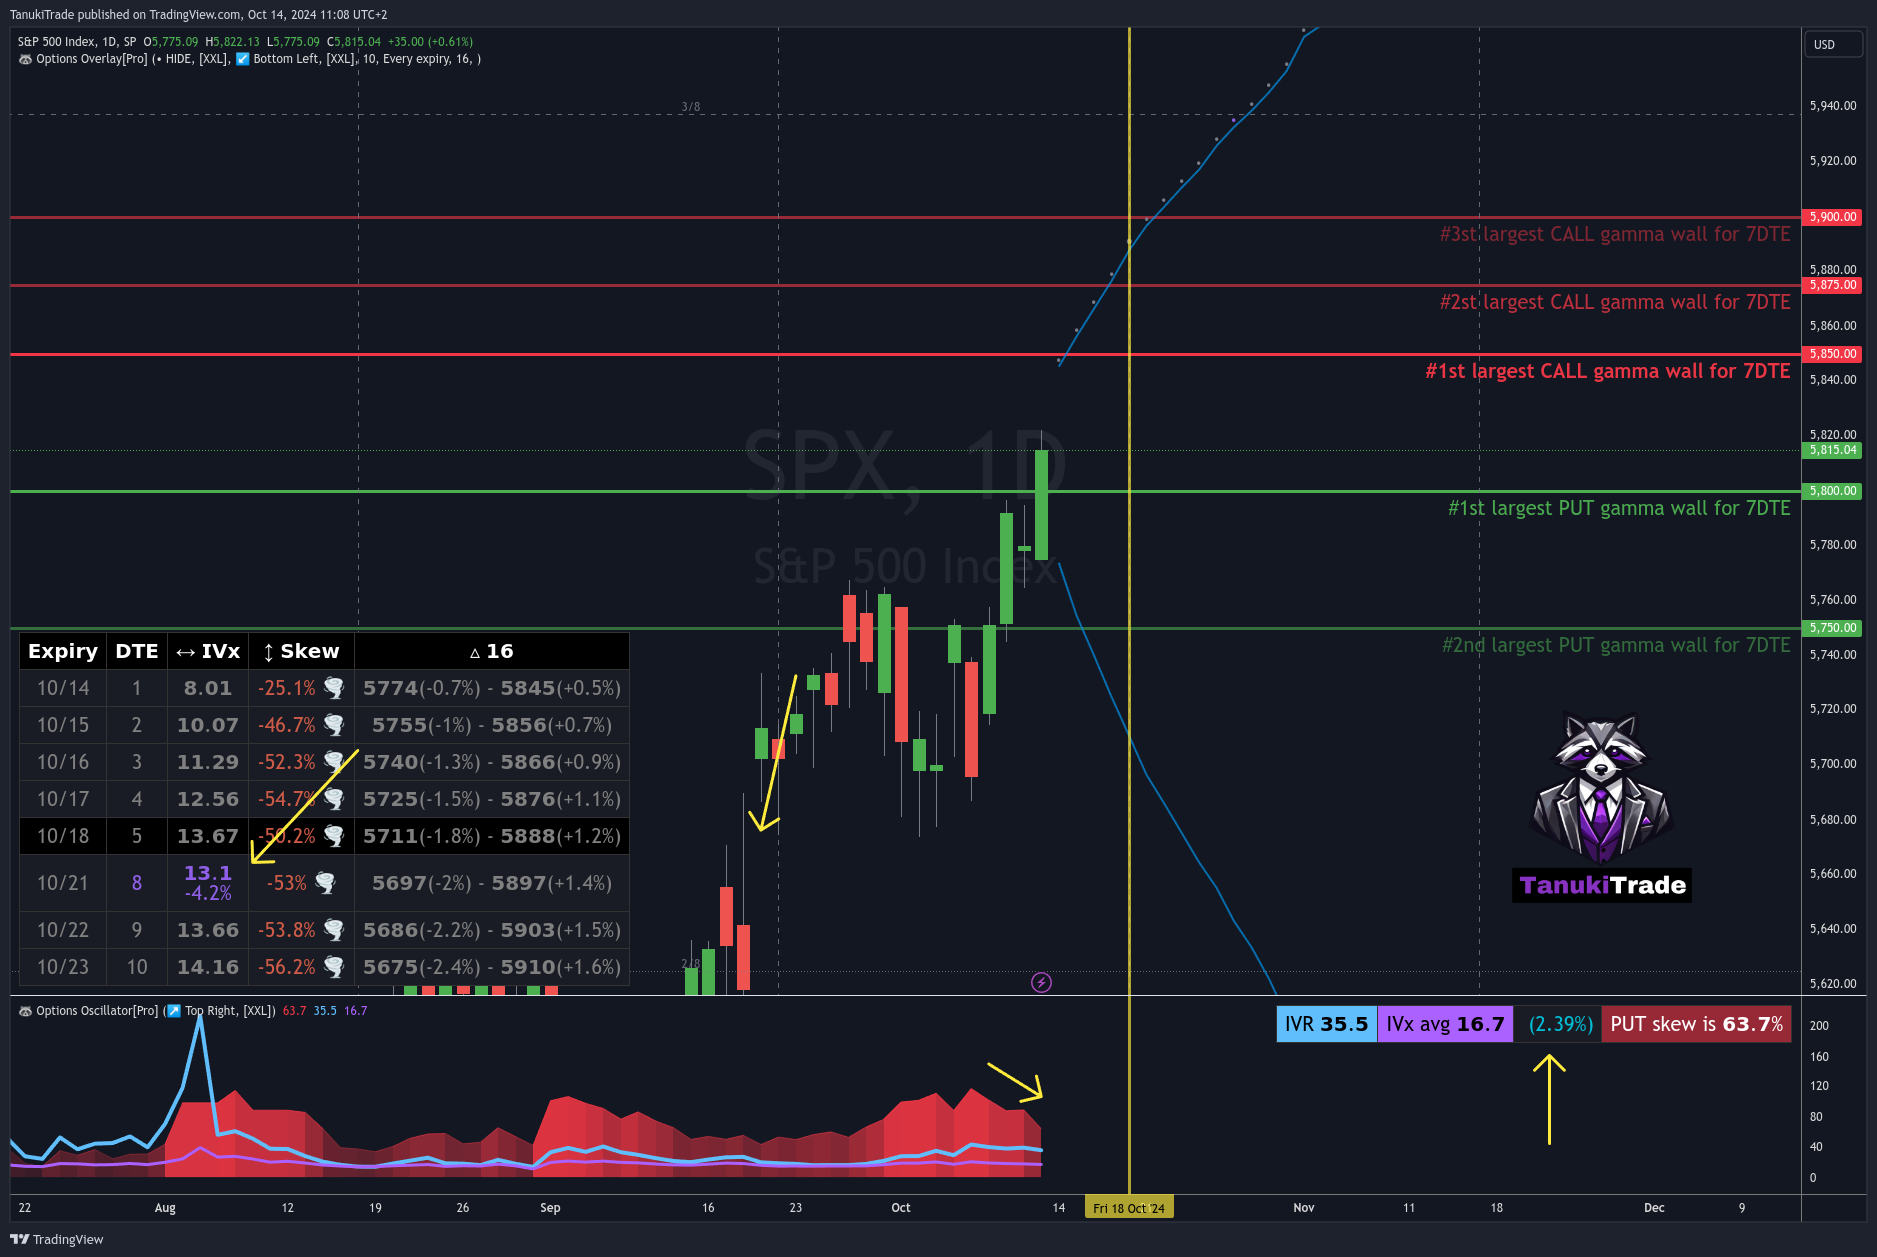
Last Friday's price action saw the SPX break through the 5800 call gamma wall, generating strong bullish momentum. This breakout opens the door for further upward movement throughout the week, especially if buying pressure persists. Breaking through a call gamma wall often leads to a rapid price increase, as these levels act as resistance, but once broken, they support further upward moves.
However, caution is advised, as additional call gamma levels (around 5850 and 5875) could pose resistance, where the price may stall. These levels can reverse roles and, if the price falters, could act as significant resistance, potentially leading to a pullback toward the 5800 level.
Put Skew and IVx Changes
The put pricing skew on the Options Oscillator shows a declining trend, meaning that while put options are still more expensive than calls at equivalent strikes, this trend is softening when looking at the November expiration. This indicates a weakening of put options relative to calls, which could be another bullish signal as demand for puts may be declining.
The five-day IVx average (implied volatility index) has been rising, indicating an increase in market volatility. Rising IV often leads to higher option premiums, so it's worth keeping an eye on how volatility develops throughout the week.
Backwardation and Diagonal Strategy Opportunities
It's also worth noting the 4.2% backwardation based on the IV skew for the expirations between 10/18 and 10/21. This backwardation (downward sloping volatility curve) could benefit calendar and diagonal spread strategies, as options with different expirations have varying volatility conditions.
GEX Wall Levels: Where Is Support and Resistance?
Gamma Exposure (GEX) levels continue to play a crucial role in the market’s movements:
On the upside, the largest call gamma wall for the next 7 days is at 5850, while the 5875 level may also act as significant resistance. The 5875 is a more likely a realistic bullish target, supported by the Options Overlay’s blue OTM delta 16 probability curve.
On the downside, the 5750 put support level currently offers strong support, with sellers forming a barrier here. The 5800 level is also interesting because it was the largest call gamma level last week, meaning there could be significant volatility as bulls and bears battle around this point.
(NOTE: The automatic GEX levels will be available in the TanukiTrade Options indicator package by the end of October.)
SPX Summary
The SPY 0.00%↑ options market is showing a bullish direction with the breakout above 5800, but it will be key to watch the gamma levels where the market might stall this week. The rising IV and declining put skew trend could provide further signals that the bull market might continue, but the possibility of resistance or a pullback remains. For those considering diagonal strategies, the backwardation may offer interesting opportunities to capitalize on.
Weekly QQQ Options Analysis (through Friday)
Decline in Put Pricing Skew and Increase in IVx
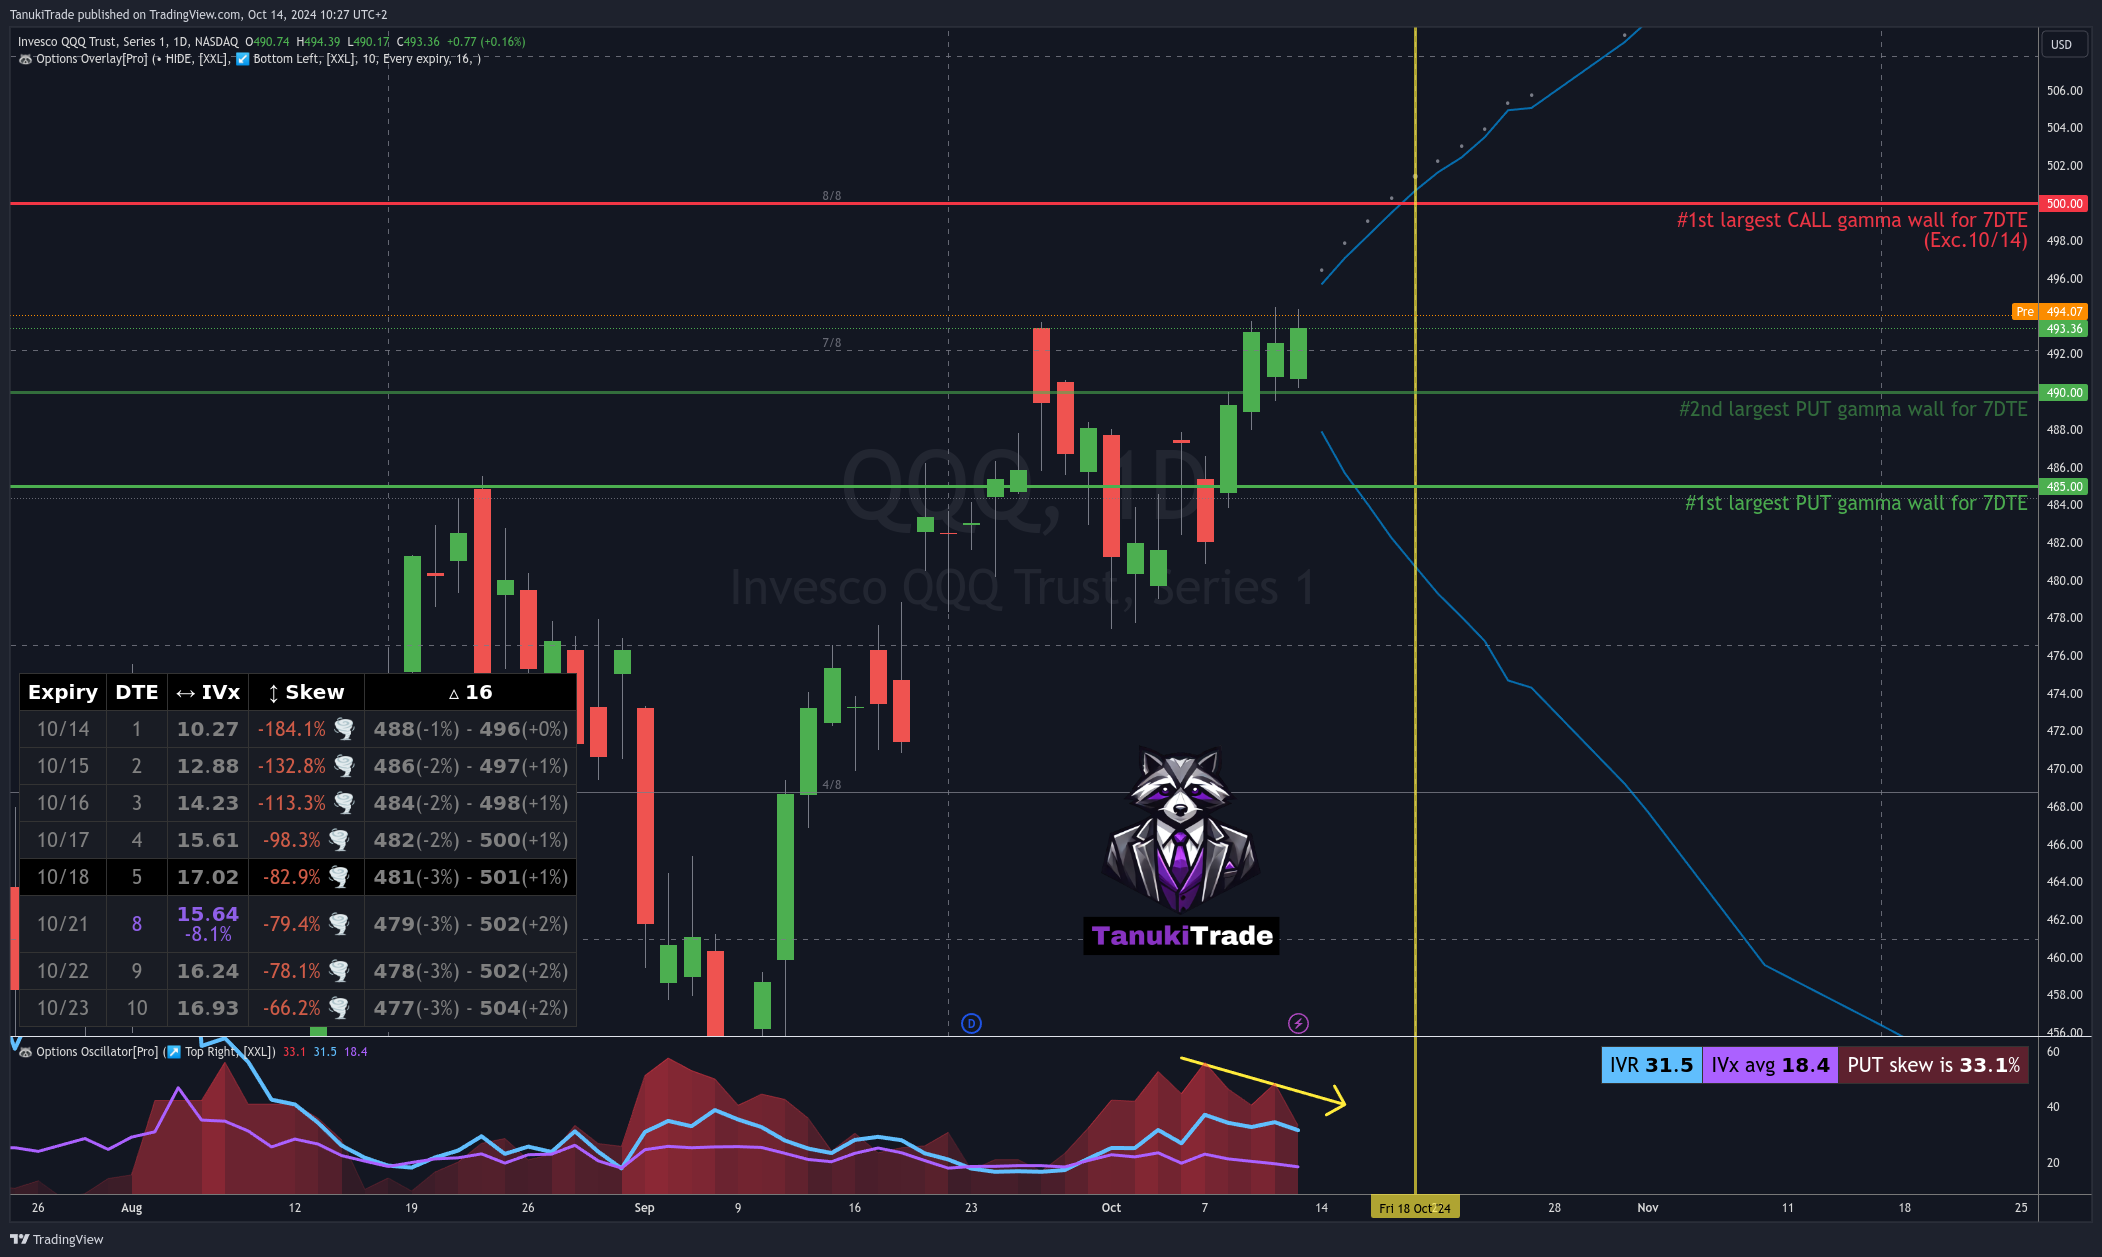
The decline in put pricing skew on Options Oscillator suggests that put options are becoming relatively cheaper, signaling a shift in market participants' expectations. This indicates increased call buying and put writing activity in the options chain. Along with the decrease in implied volatility (IV), this often points to a lower demand for downside protection strategies, which could be interpreted as a bullish sentiment.
Currently, the QQQ 0.00%↑ ’s IVRank stands at 31.8, reflecting a moderate volatility environment. However, with an average IVx of 18.4, trading volumes could increase, and interest in volatility-based strategies may rise further.
Backwardation in 5-8 DTE and Time Spreads
Backwardation in the 5-8 DTE (days to expiration) period can be ideal for time spread (calendar, diagonal) traders, as near-term options show higher volatility than longer-term ones. This creates a favorable environment for time spread strategies, especially if this backwardation persists.
Gamma Levels and Open Interest-Based Levels
Call gamma walls (or call resistance levels) typically act as resistance points. However, once these levels are broken, the bullish movement can accelerate due to positive gamma exposure. Put gamma walls (or put support levels), on the other hand, act as support. If broken, downward moves can intensify due to the high negative gamma exposure.
While the current largest gamma wall is at 495, the upcoming expiration on 10/14 could shift this level to 500, where the greatest gamma exposure will likely be after the Monday expiration (due to the large amount of open interest expiring at 495). If the price breaks above this level, it could further bolster bullish prospects. Additionally, the 500 strike plays a critical role as a major level in the Options Grid System, representing the 8/8 level.
The blue Delta Curves on the Options Overlay show the 16-delta levels, helping traders identify potential price ranges. According to current data, on the call side, the 500 strike is still within the 16-delta range, reinforcing its bullish potential.
(NOTE: The automatic GEX levels will be available in the TanukiTrade Options indicator package by the end of October.)
Time Spread Strategies
The aforementioned backwardation and gamma wall situation may present an advantage for time spread traders. Backwardation between 5-8 DTE provides an optimal window for those favoring time spreads, as the higher short-term volatility offers better premiums.
TanukiTrade Oscillator Signals
The TanukiTrade Oscillator indicates that the combination of declining put skew and decreasing IV suggests potential volatility growth on the bullish side of the market. This could be a valuable signal for both long and time spread strategies.
QQQ Summary
The decline in put skew and increase in IVx imply that market participants are anticipating an increase in bullish volatility. Backwardation between 5-8 DTE supports time spread strategies, while the call gamma wall at 495—and soon 500—is likely to serve as significant resistance/target.
Best Regards,
Gregory Peter Szilagyi
Founder of TanukiTrade Options
If you like charting on TradingView but are frustrated by the lack of available High-level Options Metrics, take a look at the option scripts we've developed and actively use.
I'm supercharging my TradingView charts with the TanukiTrade Options Overlay and Oscillator for every setup.
Experience the power of this tool for yourself with a 7-day FREE TRIAL on Annual PRO Plan
Join to our Reddit community: https://www.reddit.com/r/TanukiTrade/