
11/04 The Game Just Changed — Introducing the Seamless GEX Indicator for TradingView!
Weekly SPX Analysis + Earnings Watchlist (XLSX)

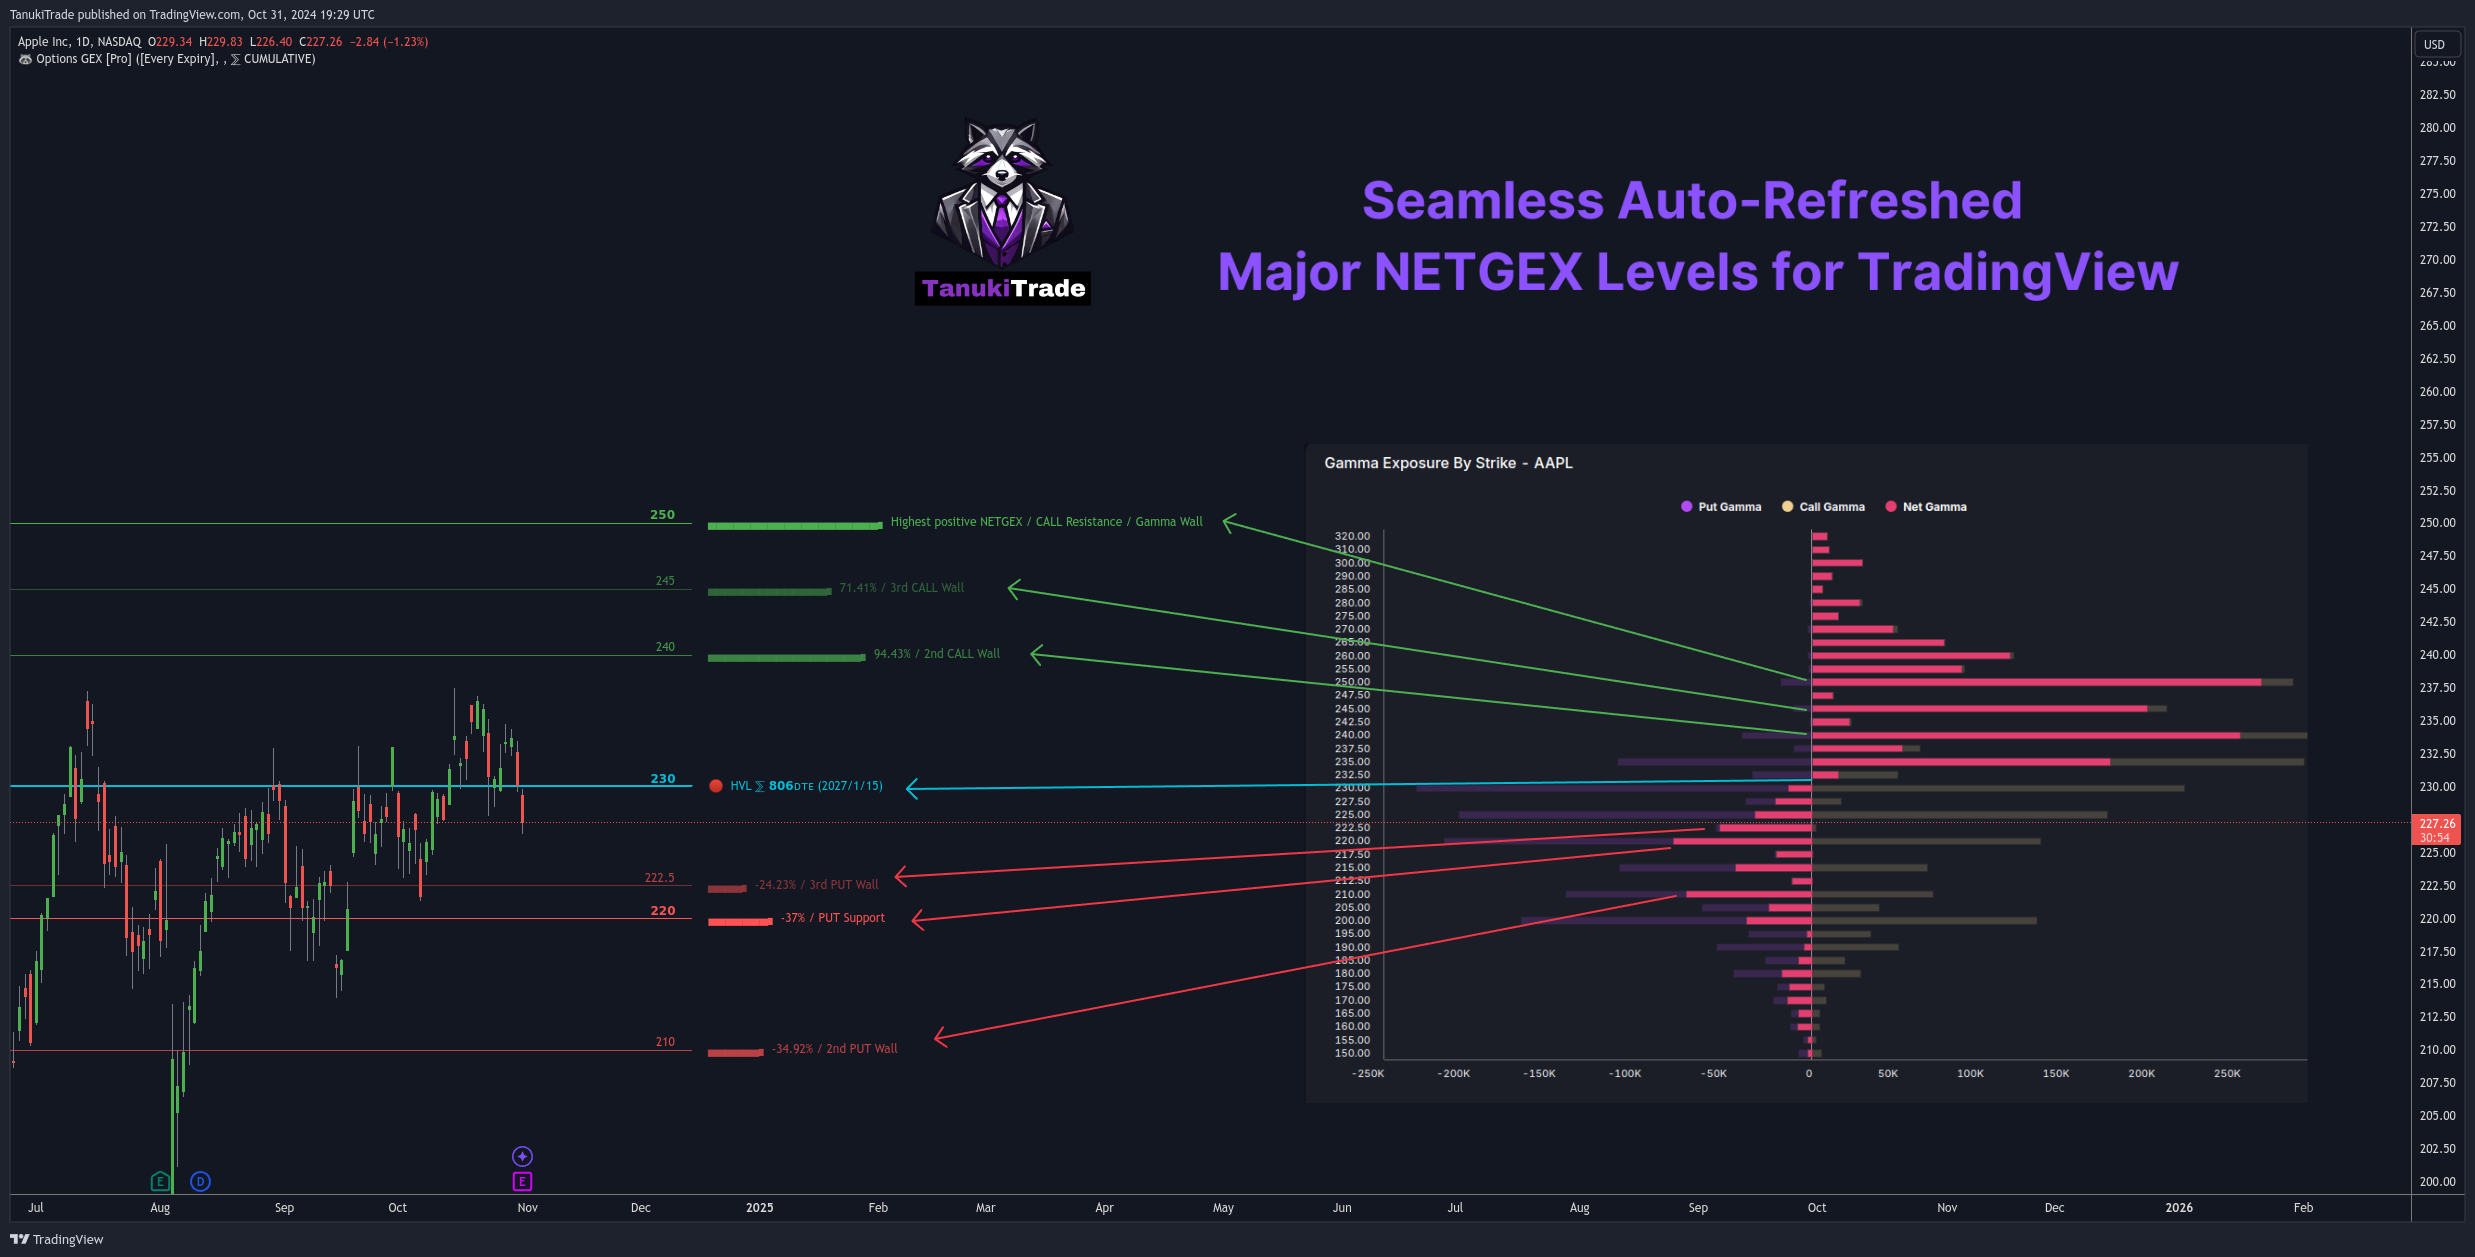
It's finally here! We’re proud to unveil our latest innovation: the Seamless GEX (Gamma Exposure) Indicator, designed to automatically keep traders up-to-date with real-time gamma levels. The TanukiTrade team has poured countless hours into ensuring this indicator can bring you precise GEX levels for the most liquid U.S. symbols directly on the TradingView platform, now easier to track than ever before.
Why Does GEX Matter, and How Can the Seamless GEX Indicator Help?
Understanding gamma levels (GEX) is crucial for options traders as they highlight those often invisible price levels shaped by hedging activity in the options market. Our Seamless GEX Indicator lets you see how these levels evolve across different timeframes, helping you gauge market stability and potential directional moves. Updated five times a day in sync with market action, it’s entirely automated, so there’s no need for manual refreshes—the indicator does the work for you!
Key Benefits of the Seamless GEX Indicator:
0DTE Levels for SPX, QQQ, SPY: View zero days-to-expiry levels directly, allowing you to trade daily setups without manually drawing 0DTE GEX levels each day.
Comprehensive GEX Profiles Across Expirations: Access NETGEX levels across multiple expirations simultaneously to maximize your strategic opportunities.
Customizable Views: Choose between Cumulative (⅀) or Selected Alone (⊙) calculation modes to tailor the indicator to your trading style.
Use Cumulative (⅀) mode to view aggregated levels across expirations, ideal for longer-term planning.
Opt for Selected Alone (⊙) mode to focus on the GEX profile of your chosen expiration, perfect for short-term (e.g., 0DTE) strategies.
HVL (High Volatility Level): Monitoring volatility levels helps gauge areas of expected stability or heightened volatility. Movement above this level generally indicates lower volatility, while movement below it suggests increased volatility. The gamma profile is negative below this level and positive above it.
We hope this revolutionary GEX indicator brings you closer to trading success, and we’re eager to hear your feedback! You can find the full documentation and setup guide [here].
To make it easy for anyone to try risk-free, we’re now offering a 7-day free trial on all our PRO plans at tanukitrade.com. You can cancel at any time if it’s not for you… though we think you’ll love it!
11/04 Weekly Analysis for Options Traders
The U.S. presidential election is on November 5, and this week we can expect increased volatility due to the uncertainty. For options traders, one thing is certain: volatility will likely rise leading up to the election, peak around the results, and then gradually subside as the “fireworks” end. It’s essential to consider this in every trading decision.
SPX Analysis

While the current Implied Volatility (IVx) isn’t extremely high, the IV Rank (IVR) is quite strong at 41, and this is likely to remain due to the increasing uncertainty. Based on the blue OTM (Out of The Money) delta curves, the market is currently pricing in a strong downward movement for the week, aligning with the negative gamma zone and negative gamma profile. For a bullish shift, we would need a strong push above 5845 to enter positive gamma territory (HVL level is the battleneck).
The 5700 level is a key PUT support across multiple timeframes. If this level breaks, turbulence is expected, with increased downward movement likely to follow, first to 5650 and potentially down to 5600, where larger PUT gamma walls are located.
According to the 16-delta OTM curve, a close above the previous all-time high is less likely. If there’s a strong breakout to the upside, the positive gamma threshold stands at 5850, and above this, buyer pressure could extend up to 5925.
I consider the 5700-5845 range as a “chop zone,” where high volatility is expected this week. In this zone, bears and bulls will be in constant battle, and I do not expect a clear trend. I focused on Friday’s expiration in this analysis, as market outlooks remain highly uncertain ahead of the election.
The strong PUT pricing skew is a natural phenomenon and is expected to increase, especially since we are in a negative gamma zone. For December expirations, PUT options cost nearly twice as much as CALL options, as shown by our oscillator for 12/20 expiry.
Timespreads will be a best choice for this week?
There’s already ~6% IV backwardation between the 11/08 and 11/11 expirations, making this ideal for time spreads. However, caution is warranted—front-month PUT calendar and diagonal spreads can easily turn negative if front IV rises more than back IV.
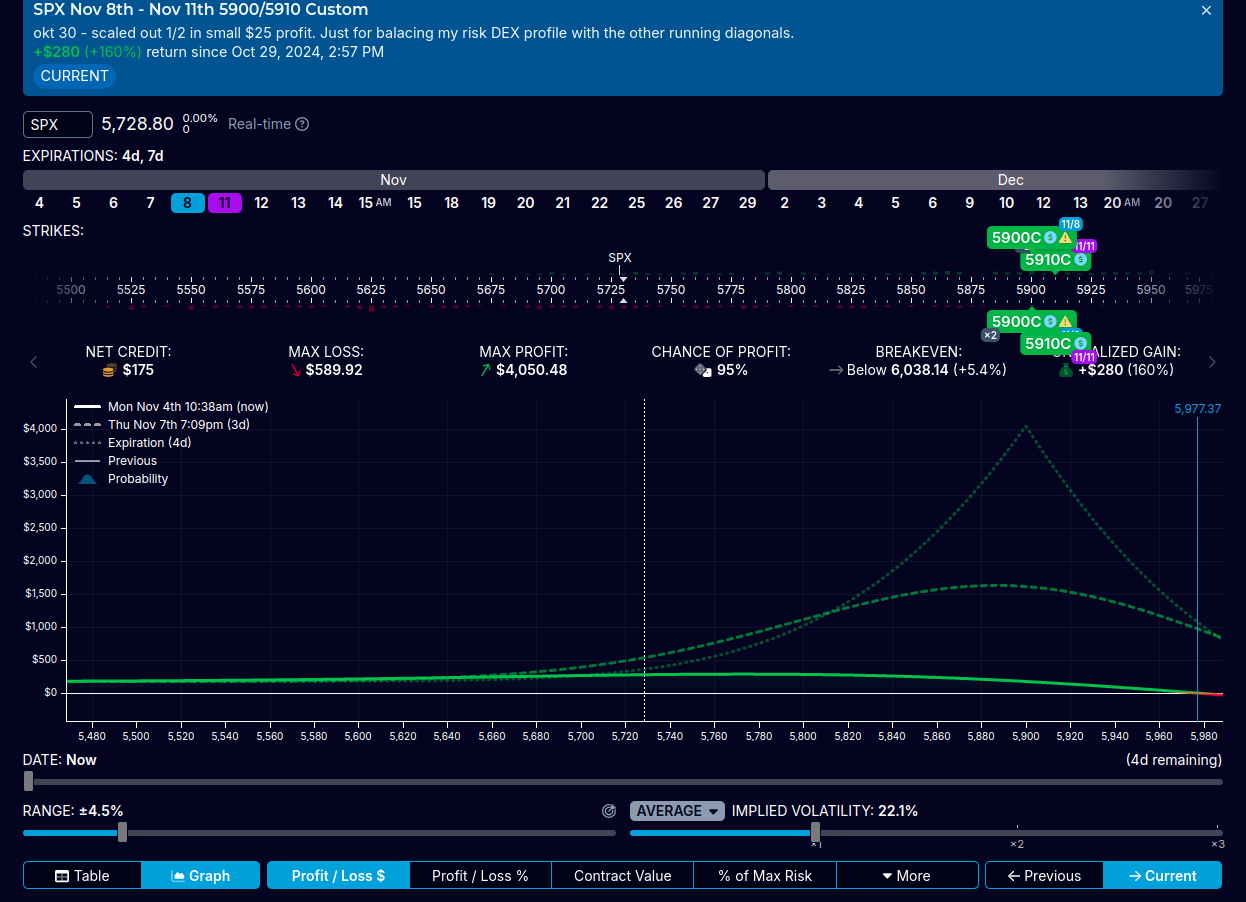
Last week, I opened a call diagonal, anticipating IV growth. With theta decay, I expect a profit “pocket” to form around the Election Day at the short leg, helping to prevent losses with proper monitoring. This makes it clear that my strategy leading up to the election is focused on omni-directional approaches that profit from IV increases.
Remember! It’s not mandatory to trade during highly uncertain periods! Staying out of the market is also a position, and sitting in cash is actually the safest choice, especially in a volatile week like this.
EARNINGS
Election or not, the earnings season rolls on. I've prepared a watchlist for this week’s earnings releases that you can save to your TradingView with one click. You can access it here: https://www.tradingview.com/watchlists/166963711/
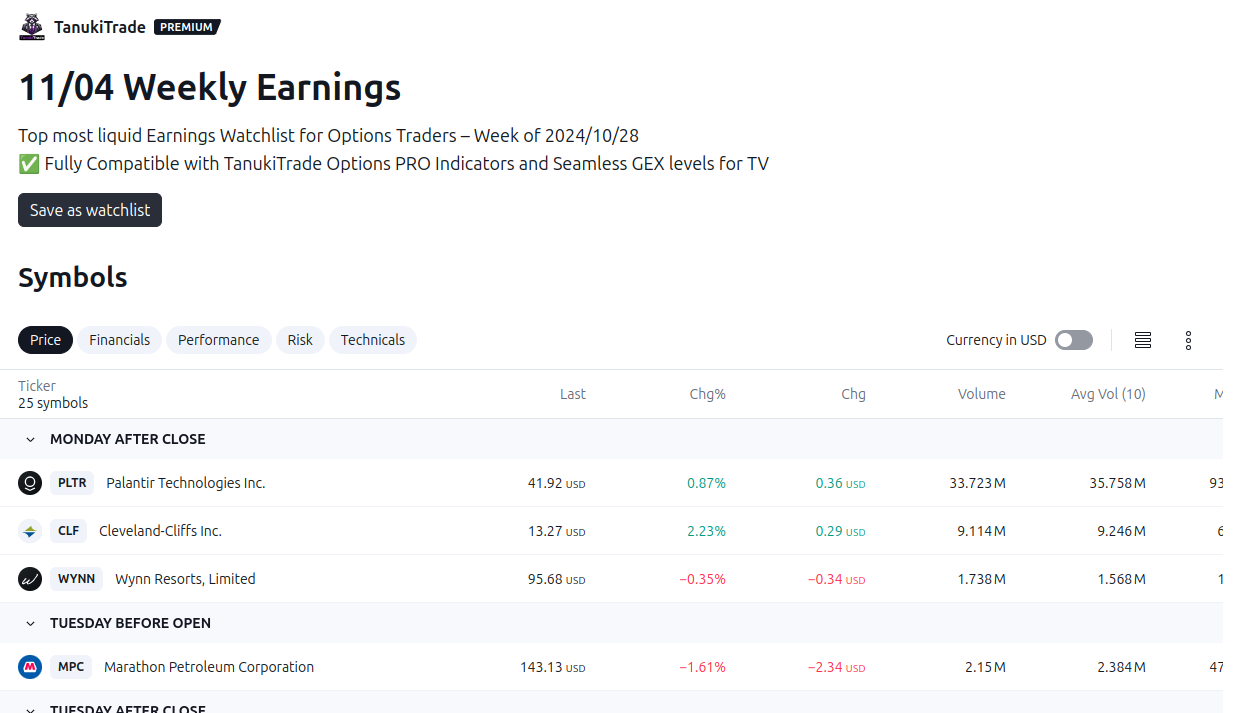
Additionally, there's a separate Excel sheet where I’ve highlighted the symbols with upcoming earnings and their current values. You can download it from here: https://docs.google.com/spreadsheets/d/13FNetbMf9UTVp08DNPEdBg0Mj9hfDlk4/export?format=xlsx

Best Regards, trade safe!
Gregory Peter Szilagyi
CEO of TanukiTrade Options - your seamless GEX provider for TradingView charts
Disclaimer: The information published in TanukiTrade Options, isn’t personalized financial advice or a specific investment recommendation and should not be interpreted as such. The content produced is intended for informational purposes only. The writers and team members of TanukiTrade.com are not investment advisors or financial planners, and you should consult your own professional before making any investment decisions. There is inherent risk involved with investing and financial decisions, and any investment decisions you make are solely your own decisions. Market outlooks, estimates, or projections should not be construed as actual events that may occur. While stats and figures are believed to be as accurate as possible from public information available at the time of publishing, the writers and team members of this publication do not make any warranties regarding the information’s accuracy. Neither the writers, team members, or affiliates accept any liability for any direct or indirect losses from the information contained herein. Team members, contractors, and guest contributors may own assets and options mentioned in their publications. By using this site or associated social media accounts, you are indicating your consent to our terms of use, and this risk disclaimer. All content published by TanukiTrade Options is copyrighted. Any unauthorized reproduction of any content published from TanukiTrade Options is strictly prohibited.
did you choose the 5900/5910 strikes for your calendar because of the 5900/5925 GEX levels?