11/18 Weekly Market Insights
Comprehensive Weekly Market Insights: SPX Updates, /ES Futures GEX Innovations on TradingView, Bond Opportunities, and Weekly Earnings Highlights with NVDA
Weekly Updates and New Features
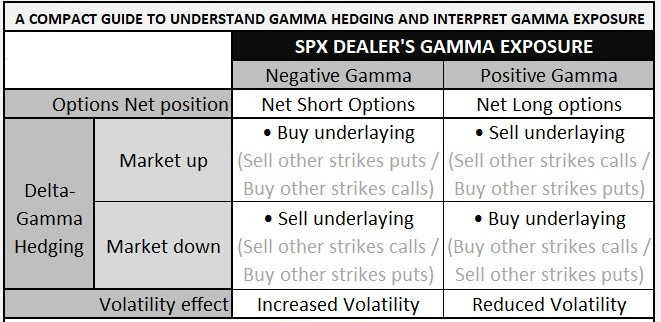
For those who may have missed it, here’s a brief overview of how GEX levels influence the market:
As you may have noticed, my weekend and today have been quite hectic. Nevertheless, I’m excited to share some great updates with you: over the weekend, we successfully made our indicators compatible with 24/7 SPX markets on TradingView (e.g., SPREADEX, CAPITALCOM).
This week is shaping up to be exciting, as we’re finally introducing seamless automatic GEX levels for /ES futures! While the indicator doesn’t rely on the /ES options chain, it uses derived SPX data and automatically adapts to any /ES expiration as you work on the charts. This means you’ll have an automatic 0DTE /ES GEX indicator until Friday! 🎉
SPX Market Analysis
Fortunately, the late newsletter hasn’t caused me to miss any significant moves on the charts.
Last week’s newsletter analysis on SPX levels became valid. As a reminder, there were no significant gamma levels below 5950 last week. Once SPX broke below that level, we saw a red gap-down to 5850 on Friday.
On Friday, SPX transitioned from positive to negative net gamma territory:
Key Takeaway: Negative gamma territory means market makers move in sync with retail traders, resulting in more intense price swings. Unless SPX reclaims the 5900 HVL level, I don’t anticipate major changes. However, as observed today, this level provides strong resistance.
Break above 5900: The next challenge would be the call gamma wall at 5925, whose breakout could open the path to higher levels.
Possible Scenarios:
Above 5925: Gamma squeeze zone with accelerated upward movement.
Between 5900 and 5925: Consolidation zone with sideways action.
Below 5900: High volatility zone with more intense price movements.
Below 5850: If the put gamma support breaks, expect turbulence toward 5810-5800.
IV and Skew Data:
IVR: 16.9, showing signs of increase.
IV Average: 14.9, also trending higher.
Put Skew: 31.5%, rising steadily.
TLT Analysis: Exciting Opportunities in Bonds
Let’s switch gears to something unique: $TLT (iShares 20+ Year Treasury Bond ETF). Below is a detailed analysis:
The GEX (Gamma Exposure) profile across all expirations shows no significant negative gamma shifts above $88. This indicates that beyond this level, substantial volatility increases are unlikely.
Currently, the price is trading within the $89.5-$90.5 range, marked by:
Put Support: $89.5
Call Resistance: $90.5
This setup suggests $TLT is preparing for a significant move.
Potential Scenarios:
Breakdown Below $89.5: Expect strong downward momentum.
Breakout Above $90.5: A gamma or short squeeze could propel the price to the next resistance at $92.
Regardless of the direction, we’re looking at exciting market action ahead.
The Call/Put pricing skew for the 11/27 expiration leans bullish, with call options currently showing a 32% premium. However, this call dominance appears to be diminishing over time.
Strategic Recommendation:
Wait for the breakout direction from the current consolidation. With volatility already on the rise, an omni-directional strategy could be favorable, offering higher success rates compared to picking a directional trade now.
Weekly Economic and Earnings Outlook
This week’s economic calendar is relatively quiet, suggesting a calmer macroeconomic backdrop.
11/18 Weekly Earnings XLSX download: https://bit.ly/4ezhpss
11/18 Weekly Tradingview watchlist: https://www.tradingview.com/watchlists/168514043/
Earnings season remains a key focus. Pay close attention to NVIDIA’s ( NVDA 0.00%↑ ) report after Wednesday’s close. Given NVIDIA’s significant market influence, its results could set the tone for the rest of the week.
Keep an eye on NVDA, as its movements could drive activity not just in the stock itself but also across broader market indices.
The price is currently at the HVL level, with market participants uncertain about the next direction. Due to the strong call skew, the 135 put support could hold off a potential drop. On the upside, the 150 level is the positive gamma wall. If we break above it with volatility, a new all-time high could be reached.


