Market Recap: Riding the September Roller Coaster | 09/16 Options Newsletter
Every week we review everything you need to know about the stock market for the week ahead as an active options trader.
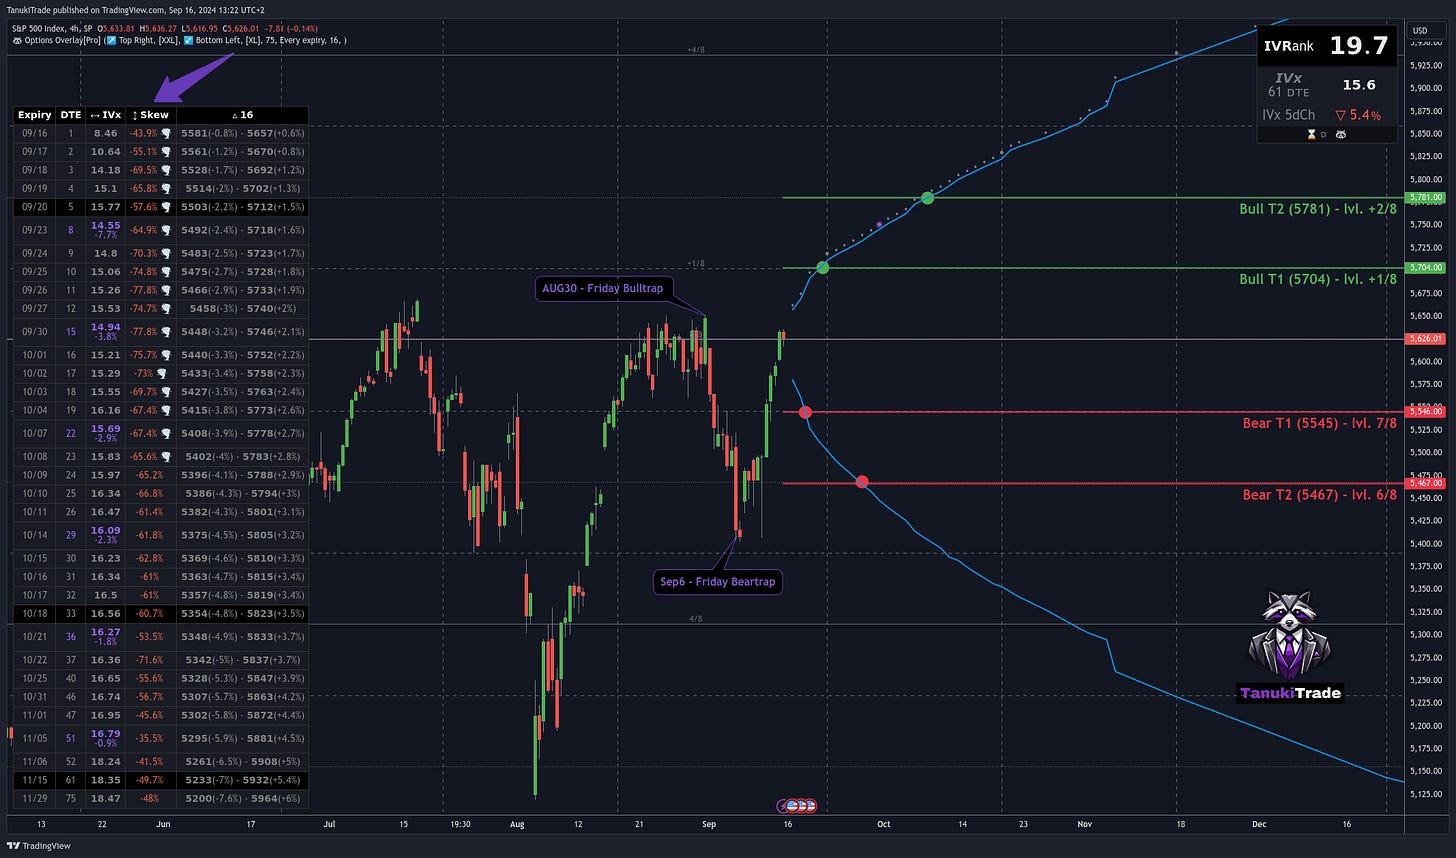
The past seven weeks have been a wild ride, perfectly embodying the notorious traps of September. Last month ended with a bullish breakout on the SPX, only to see the market drop sharply the following Monday. Fast forward to Friday, September 6, and after a massive bearish candle, the market saw a fierce buying spree the next week.
Technical Breakdown: SPX Levels in Focus
Looking purely from a technical standpoint, our Grid System shows the SPX currently hovering at the 8/8 level on a 4-hour timeframe. Here’s what we’re watching:
Potential Bullish Targets:
Bull T1: 5704 (Level +1/8)
Bull T2: 5781 (Level +2/8)
Potential Bearish Targets:
Bear T1: 5545 (Level 7/8)
Bear T2: 5467 (Level 6/8)
Options Insight: Analyzing SPX with a Distribution Overlay
Switching gears to options analysis, we overlay the SPX chart with a log-normal distribution curve from the Options Overlay, focusing on OTM 16 Delta levels.
Reviewing the expiry table shows no significant IV rank or implied volatility on the SPX, but a notably high put skew. This indicates a market heavily hedged with put buying and call writing—a clear sign of caution.
Marking the T1 and T2 levels on the chart with green and red dots highlights how much faster SPX might reach bearish targets, especially the T2 level, where downward moves could occur swiftly.
This put skew reflects in the options pricing: put options are priced higher than calls at the same OTM distance, a vital consideration for options traders navigating this market.
Economic Events on the Radar
Looking ahead, the most significant event risk centers around the Wednesday Fed rate decision. Markets are pricing in a potential rate cut, which could shake things up after a long hiatus of steady rates.
Trading Strategies for High Put Skew Environments
For me, I’m definitely staying on the sidelines until the Wednesday event this week, as the market hasn’t chosen a direction yet—I won’t be taking any positions until then. (I don’t like gambling). Until than I’m good with babysitting my current positions: before event risk I will close most of the directional ones.
After that, my market assumptions and the prevailing volatility environment will dictate which positions are worth opening.
Given the current conditions— mid IV, mid IV rank, and a pronounced put skew—here’s a quick playbook of strategies to consider post-Fed decision:
Bullish Assumption with Put Skew:
Normal IVrank + Rising IV: OTM call calendar or diagonal spreads can capitalize on upward moves and rising volatility.
Normal IVrank + Decreasing IV: Broken wing put butterfly or put credit ratio spreads are solid choices, but my personal favorite is the classic Jade Lizard as omni directional bullish strategy for decreasing volatilty.
Reducing Vega Risk: Vertical put credit spreads mitigate IV swings while leveraging the put skew, capturing higher credits closer to the money.
Bearish Assumption with Put Skew:
Normal IVrank + Rising IV: Call credit OTM diagonals profit from quick bearish moves, leveraging rising IV, but keeping the upside profit potential by time.
Normal IVrank + Decreasing IV: Put debit ratio spreads offer a strategic approach with negative delta, adjusting the long put leg for credits during market drops.
Reducing Vega Risk: Vertical debit put spreads take advantage of the put skew, providing cost-effective entries compared to call vertical spreads.
This is just a brief overview of enforceable strategies. I’m planning a comprehensive guide for October, including a cheat sheet that aligns with the TanukiTrade Options Overlay indicator.
Until then, trade safe and stay tuned!


