10/21 SPX Weekly GEX + Earnings ENPH, MMM, VRT, BA, TSLA, T, AAL, STX
Key SPX gamma levels and resistance for the week. Options outlook during peak earnings season. ENPH, MMM, VRT, BA, TSLA, T, AAL, STX
Weekly SPX Options Analysis – October 21, 2024
Although the SPY 0.00%↑ is currently trading within a relatively neutral positive gamma range, it’s worth taking a closer look at what the week might hold.
Important: Our auto-updated GEX level indicator is launching on TradingView this week, so you’ll finally be able to see these levels in action using the TanukiTrade Options Toolkit—I'll post a separate update about this soon!
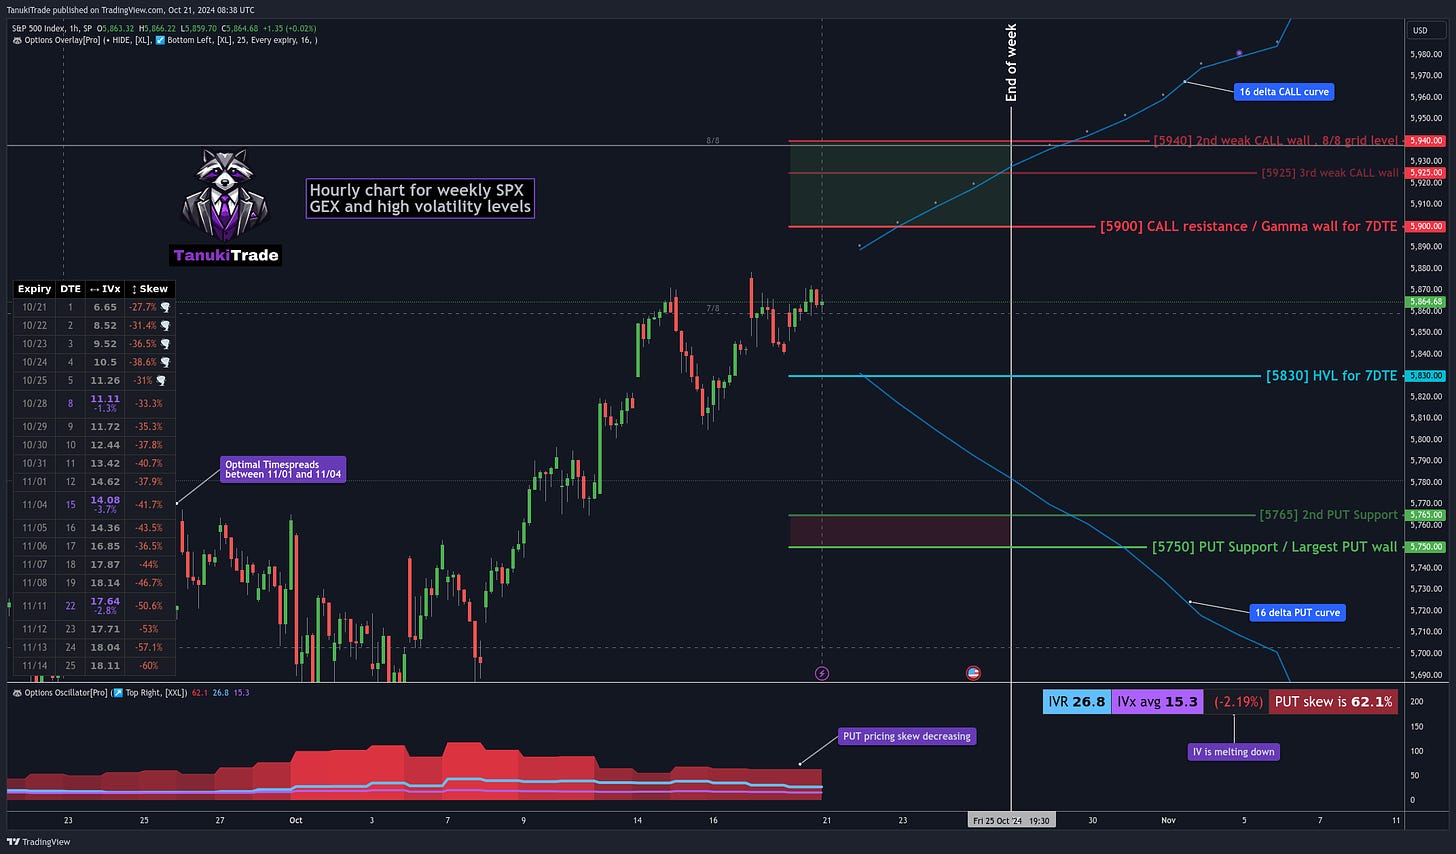
Main Resistance: 5900 CALL Gamma Wall
This week, SPX is moving between critical resistance and support levels, which are showing significant options activity. The 5900 level is the key CALL resistance, acting as the gamma wall for the next 7 days (7DTE). This suggests that as long as the price remains below this level, it will face strong resistance in moving higher. If the market breaks through this level, it could signal a bullish breakout, leading to increased turbulence.
In case of a breakout, keep an eye on the second weaker CALL wall at 5925 and the third weaker CALL wall at 5940, which are the next potential resistance levels once the market moves past the 5900 gamma wall. These levels could play a pivotal role in the price’s upward movement and indicate further buying pressure.
HVL Level and Gamma Environment: 5830
The 5830 level represents the High Volatility Level (HVL), which determines whether we are in a positive or negative gamma environment. If SPX closes below this level, we enter the negative gamma zone, which could lead to increased market volatility. This could result in sharper price movements during the week if this level does not hold. In that case, the PUT supports come into focus.
The 5750 level marks the strongest PUT support, providing substantial downward support for the market. However, before reaching this level, it’s important to consider the emerging PUT wall at 5765, which may stop the price from falling lower. This could act as an intermediate support, slowing or even halting a decline before the 5750 level comes into play.
SPX Key Levels This Week:
5900 CALL resistance – Main gamma wall, strong resistance.
5925 and 5940 – Second and third weaker CALL walls, offering additional resistance if broken.
5830 HVL – Key level determining the gamma environment.
5765 PUT wall – Emerging intermediate PUT support, which could slow a decline.
5750 PUT support – Strongest PUT gamma wall and support.
Keep these levels in mind throughout the week, as they will likely influence market movements and the volatility environment. By applying the right options strategies, this information can help you structure profitable positions.
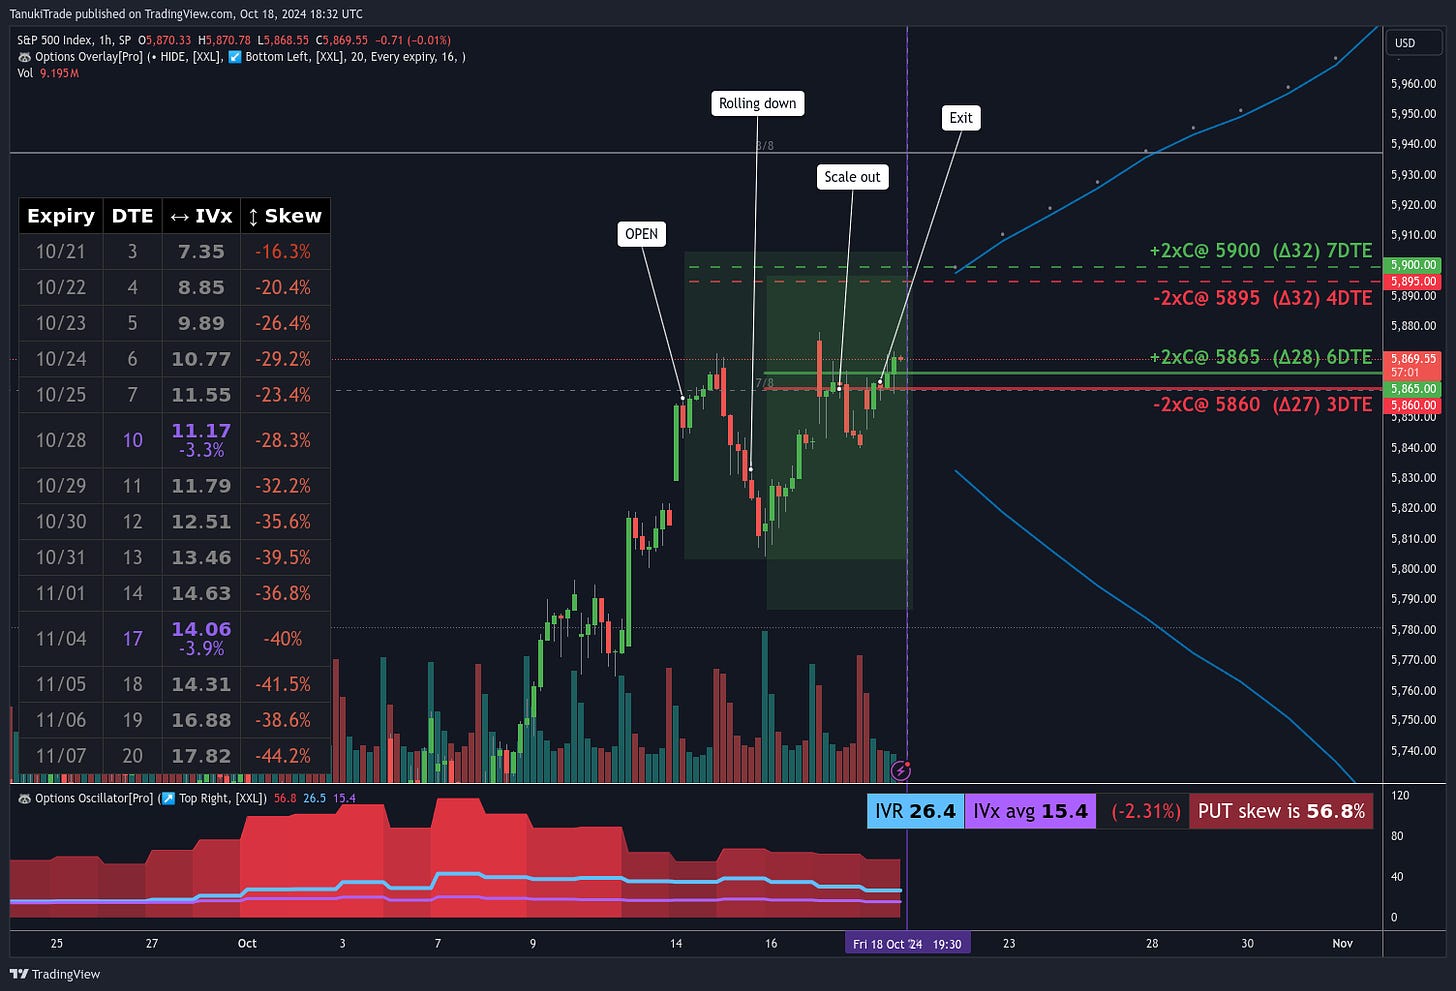
30% ROC Example in 4 days on SPX last week | My real trade
In last week’s newsletter, I mentioned a diagonal SPX call setup, which I was able to capitalize on for nearly $300 profit on $1000 margin with relatively low risk. I did have to roll down a day after opening, but the profit curve still opened up nicely. If you’re interested, I wrote about it in my trading journal here.
Implied Volatility and Time-Based Strategic Opportunities NOW
The decrease in implied volatility, as shown by the IV and IVx indicators, signals a calmer market environment. Based on IV rank and average IV levels, volatility is running lower, which presents good opportunities for various spread strategies, especially time spreads that can be optimized between the 11/01 and 11/04 time frame.
Key levels above could fuel further market movement throughout the week if a breakout occurs. CALL/PUT gamma levels on the options chain strongly outline the potential resistance and support levels, but these levels can change dynamically, especially if SPX breaks through the 5900 level.
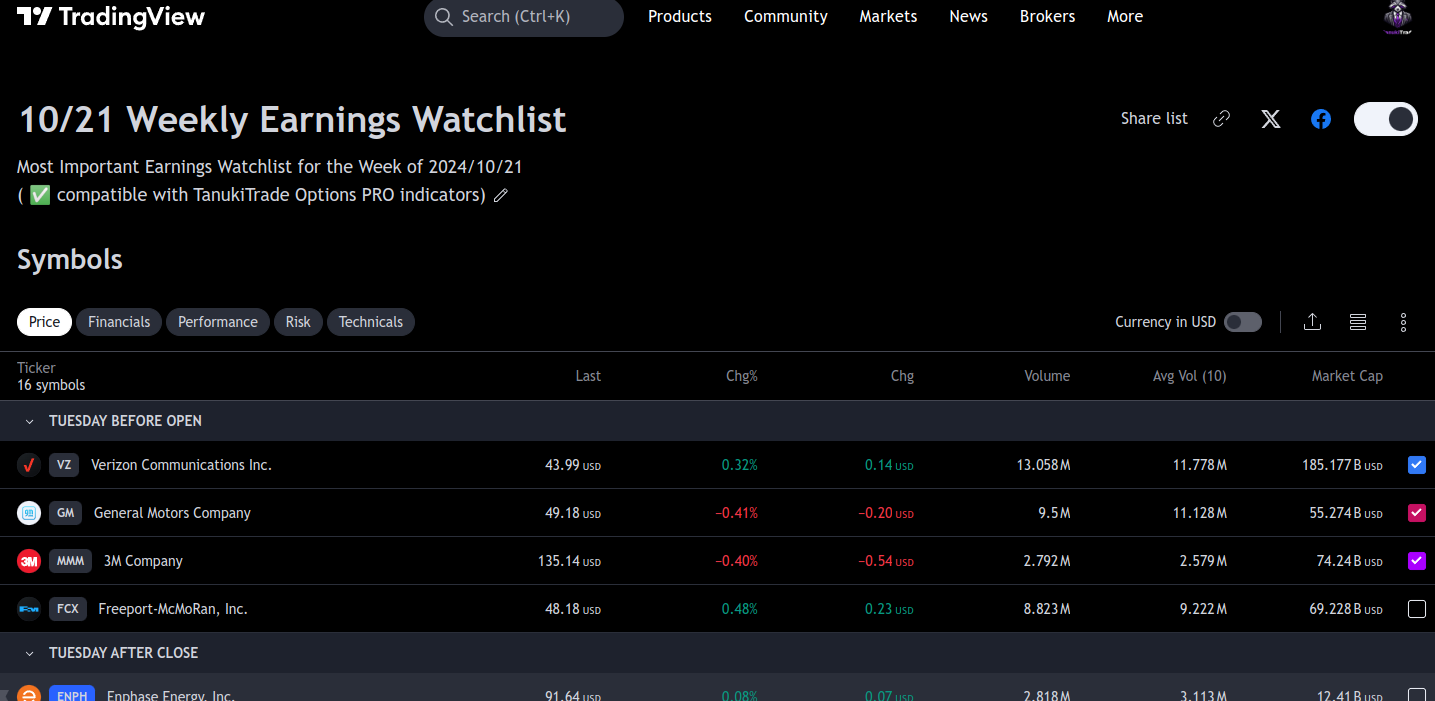
Weekly Earnings Watchlist for the Lazy: One-Click Save to TradingView
This week, earnings season rolls on, and I’ve put together something for options traders. With just one click, you can save a custom watchlist of the key symbols impacted by this week’s earnings directly to your TradingView account: https://www.tradingview.com/watchlists/165618331/
The symbols on this list are selected from an options trading perspective, focusing on stocks that work well for multi-leg strategies. For those who follow my trades, you know I tend to avoid setups just before earnings, as they tend to be more like gambling with their binary nature. What I really prefer, and has worked for me in about 8 out of 10 trades, are setups opened 30-60 days after earnings, targeting the implied volatility (IV) meltdown.
From my experience, post-earnings reports result in an immediate IV drop, followed by a slower decline over the next ~45 days, which creates an ideal setup for neutral or omni-directional strategies like iron condors, strangles, put ratios, and my favorite, the jade lizard. Unless there’s a bullish breakout, price action usually narrows down in the days following earnings.
Here are the stocks with the highest implied moves, signaling potential for big price swings, along with their binary expected move (implied move) for the closest expiration:
ENPH: ±12.16%
VRT: ±10.53%
STX: ±7.41%
TSLA: ±6.9%
MMM: ±6.9%
AAL: ±6.8%
However, what really interests me from this week’s list are the stocks with both high IV and high IVR, where there’s either no call/put pricing skew or the skew points clearly in one direction:
Symbol, IVR, IVx, Call/Put Pricing Skew:
MMM 0.00%↑ : 99 IVR, 46 IVx, Neutral
ENPH 0.00%↑ : 92 IVR, 88 IVx, Bullish call pricing skew
VRT 0.00%↑ : 57 IVR, 73 IVx, Strong call skew (calls are ~68% more expensive than equidistant puts)
BA 0.00%↑ : 83 IVR, 46 IVx, 38% call pricing skew (recently hit hard, but long-term outlook remains optimistic per options pricing)
TSLA 0.00%↑ : 38 IVR, 57 IVx, Bullish call skew (calls are 45% more expensive than puts)
T 0.00%↑ : 86 IVR, 35 IVx, Neutral
AAL 0.00%↑ : 82 IVR, 62 IVx, Increasing call skew
These stocks are likely to maintain elevated IV levels immediately after earnings, making them great targets for IV scalping around the ~60 DTE range.
ENPH Earnings Example - Using GEX Levels and the Options Overlay Indicator
Let me show you an example of how to use the GEX levels and the Options Overlay and Option Oscillator indicator:
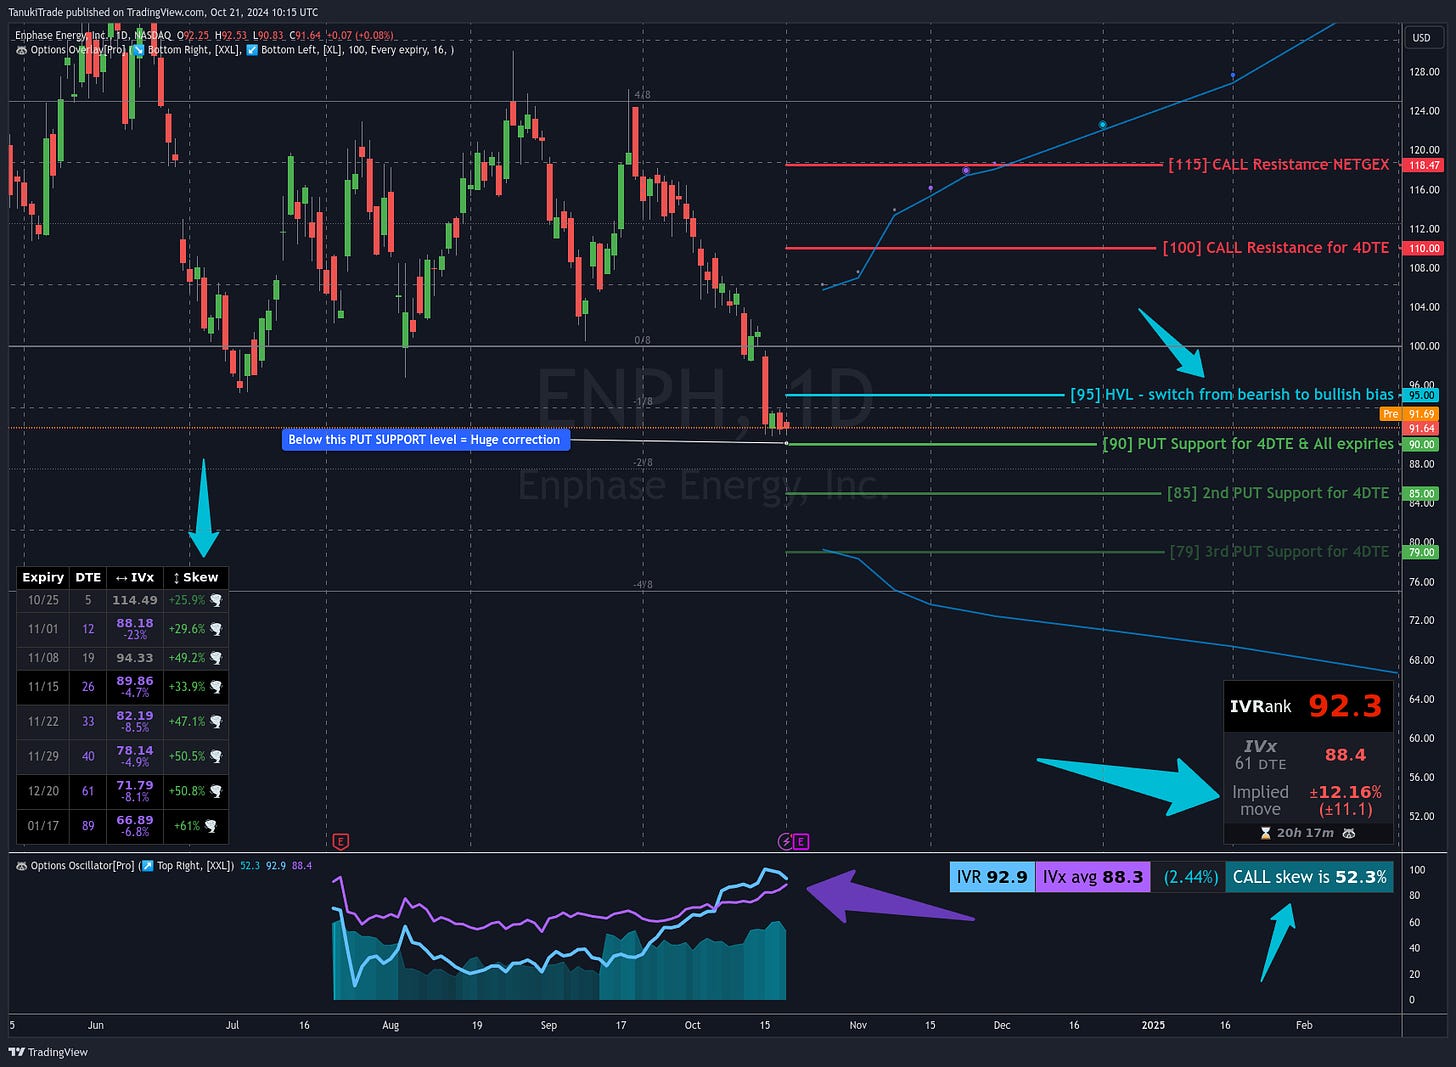
ENPH 0.00%↑ reports earnings after the market closes on Tuesday.
Currently, it is in a negative GEX range, as the spot price (91.69 premarket) is below the HVL.
The implied move is 12.16%, meaning the market expects a significant price swing. (This is the binary expected move for the closest expiration, which is Friday).
IV is rising sharply, likely staying elevated until the earnings release, and a large number of CALL options are being purchased, as the price of CALLs is higher than PUTs.
We can see that the HVL (where the gamma exposure flips) is very close at 95, and the biggest PUT wall is nearby at 90.
If it closes above 95 after earnings, the gamma profile will completely change, flipping into positive territory.
If it drops below 90, there’s room for a move down first toward 85 and potentially as low as 79.
Such a tight pre-earnings range suggests a large post-earnings move, so it’s crucial to consider these levels before making any decisions after the report
Note: Keep an eye on IV and implied moves as we get closer to earnings, as they are likely to increase. The numbers listed here reflect the current state.
Best Regards,
Gregory Peter Szilagyi
Founder of TanukiTrade Options
If you like charting on TradingView but are frustrated by the lack of available options metrics, take a look at the option scripts we've developed and actively use. I'm supercharging my TradingView charts with the TanukiTrade Options Toolkit for every setup.
Experience the power of this tool for yourself with a FREE TRIAL!
Disclaimer: The information published in TanukiTrade Options, isn’t personalized financial advice or a specific investment recommendation and should not be interpreted as such. The content produced is intended for informational purposes only. The writers and team members of TanukiTrade.com are not investment advisors or financial planners, and you should consult your own professional before making any investment decisions. There is inherent risk involved with investing and financial decisions, and any investment decisions you make are solely your own decisions. Market outlooks, estimates, or projections should not be construed as actual events that may occur. While stats and figures are believed to be as accurate as possible from public information available at the time of publishing, the writers and team members of this publication do not make any warranties regarding the information’s accuracy. Neither the writers, team members, or affiliates accept any liability for any direct or indirect losses from the information contained herein. Team members, contractors, and guest contributors may own assets and options mentioned in their publications. By using this site or associated social media accounts, you are indicating your consent to our terms of use, and this risk disclaimer. All content published by TanukiTrade Options is copyrighted. Any unauthorized reproduction of any content published from TanukiTrade Options is strictly prohibited.


