11/25 Weekly Insights: MSTR & SPX Analysis
IBIT and /ES futures support live + Educational Options Strategy on MSTR
GREAT NEWS,
We’ve updated our indicators today, and the /ES futures support levels, along with the IBIT and MSTR symbols, are now available in our Options GEX and Overlay indicators.
It’s worth noting that for /ES futures, our indicators utilize dynamic derived data with mapping SPX powered by AI. The first data package is expected in the indicator approximately 15 minutes after the market opens for IBIT 0.00%↑ and MSTR 0.00%↑ .
I trust you’ll find it enjoyable!
Haven’t purchased our PRO indicators yet? Now’s the time! Starting next week,
prices will increase due to rising costs, so this Black Friday week is your last chance to get them at this discounted rate.
SPX Weekly Overview
By the second half of the week, we managed to regain the positive gamma zone.
As I highlighted last week, there was a gamma squeeze zone above 5825. That prediction worked out exceptionally well, with Thursday’s close forming an unusually large green doji. This set the stage for Friday’s positive closing sentiment.
Looking at the weekly GEX levels, let’s first examine the cumulative GEX on a 1-hour SPX chart. The SPREADEX:SPX ticker already showed a gap-up before market open:
or those seeking cost-effective time spreads (calendar or diagonal), the expiration combinations 12/06-09, 12/19-22, and 12/20-23 could be promising.
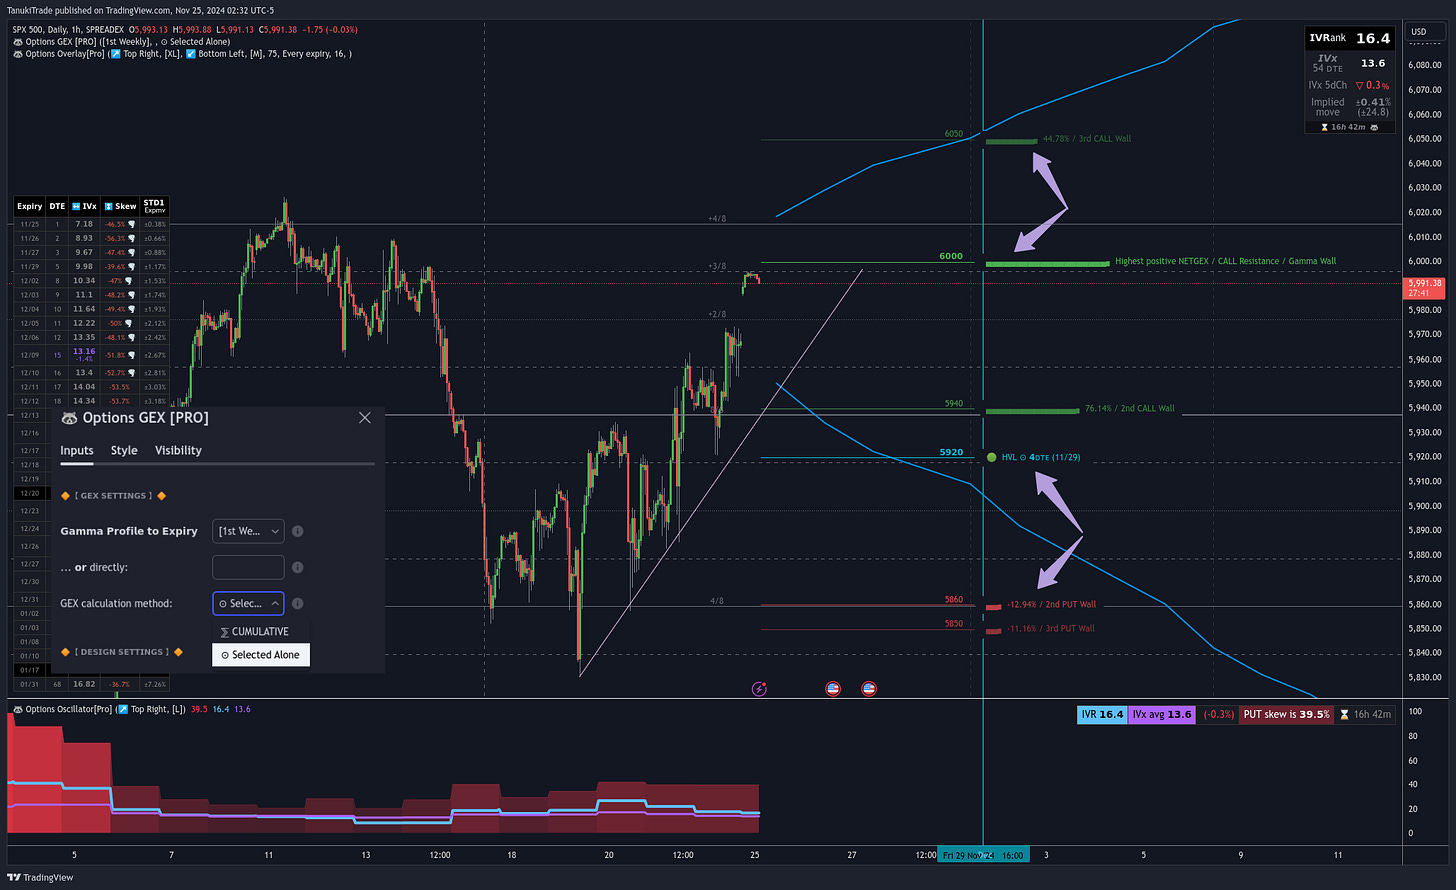
Currently, the familiar 6000 zone marks the call gamma wall with the largest call exposure. It acts as resistance until breached, after which it becomes a catalyst for upward movement, especially above the grid system +4/8 level.
In the context of the upward micro-trend, the 5940 call gamma wall could serve as strong support before the price tests lower levels.
Above 5920, we remain in bullish territory (grid system 8/8 level).
Below 5900, however, caution is warranted, as downward movement could accelerate.
You might ask: What happens above 6000 or below 5900? How can I see these details?
This is where switching from the “Cumulative” model to the “Selected Expiration” calculation model becomes helpful. In this view, you can focus solely on Friday’s expiration to get a clearer picture.
The same chart in the “Selected Expiration” GEX view:
It becomes evident that above 6000, the next level is 6050, while below the 5920 gamma flip zone, the 5850-5860 range could serve as strong support or resistance (grid system 4/8 level).
An upcoming update will make it easier to visualize the gamma exposure strength of each expiration directly on the chart. I’m personally eager for this improvement, as it’s something I’ve been missing. I hope to bring this enhancement to you in next week’s update, making it easier to see which expirations are most significant—something many of you frequently ask about.
MSTR Example – How to Use Our Options Metrics?
A frequently asked question is whether there’s an exact guide on how to use the numerical indicators provided by our options tools.
My answer is always the same:
if you have a solid understanding of options and know what you’re looking for, our documentation will already be helpful.
if you’re a beginner, these indicators will serve as excellent companions during your learning journey.
Since many in our community are still getting familiar with these tools, I thought I’d walk through an example with $MSTR to provide an educational demonstration of how to apply the metrics in practice.
(Note: these examples are strictly for educational purposes and are not investment advice. Please do not blindly open positions based on these illustrations!)
MicroStrategy (MSTR) Example Strategy – OTM Call Butterfly
Analyzing the MicroStrategy Incorporated chart, we can observe a massive call skew. For the December expiration, call options are priced 4x higher than put options. The IVR is extremely elevated at 109, and the IVX is at a staggering 228. This is a highly unusual situation:
The blue 16 OTM option curve shows that the market is pricing the stock exponentially to the upside on the call side, far beyond the expected 68% normal distribution range. For the December expiration, the 610 strike holds the largest positive gamma exposure. Despite Thursday’s large red candle, the positive GEX profile remains intact above 400.
How Can We Capitalize on This?
If we believe the stock price will rise further by December, simply buying a call option is not a viable choice. The calls are priced 4x higher than puts, making this option prohibitively expensive.
The Solution: OTM Call Butterfly with Flat Delta
We can take advantage of the extreme call pricing skew, the high IV, and the bullish sentiment with an OTM Broken Wing Call Butterfly strategy with flat positive delta. Here’s an example using the following strikes:
+1x 500C
-2x 610C
+1x 750C
This is just one configuration; you can adjust the strikes to suit your capital and risk tolerance.
Why Could be This Strategy Effective?
Flat delta: The position has a delta below 1, making it very flat but slightly bullish.
Theta profit: At the current price, the strategy has a theta of 18.1, generating $18 daily from time decay.
Flexible profit potential: This strategy benefits if:
IV decreases,
The price moves higher,
The price stays the same.
Breakeven Levels and Risk Management
Over time, the breakeven levels expand:
Downward to 350,
Upward to 750.
Breakeven improves further if:
IV decreases,
More time passes.
Critical Level: 610 Strike
It’s crucial to avoid letting the price stay significantly above the 610 strike, as the trade could turn sharply negative. Similarly, if the price drops below the 350 gamma wall, the original bullish thesis may no longer hold, warranting a reassessment.
Realistic Profit and Loss Levels
Take profit: A 20% return on margin is reasonable, translating to approximately $600-700 with a high probability of success.
Stop loss: Exit the position if:
The price hits 610, or
The price falls below 350, breaching the gamma wall.
Notice that with these stop levels, the maximum loss is capped at around $100 (barring a significant gap move). Meanwhile, the potential maximum profit remains considerably higher.
Obviously, if you're aiming for a bearish, neutral, or even more bullish strategy, you can adjust the legs to find the setup that suits you best. However, be aware that the bid/ask spread can be wide on the chain, so it’s important that the legs aren’t too close to each other, as this could prevent the position from opening properly.
Here’s the OptionStrat example setup link as playground: https://optionstrat.com/qG0EcAXAfBu2.
As a side note, on the OptionStrat free Discord server, users engage in daily discussions about my indicators in the "trading-floor" channel. Joining the server could be helpful if you're looking for additional support or ideas by option trader community using TanukiTrade indicators!
Weekly Economic
This week promises to be eventful, with FOMC meetings on Tuesday and Wednesday, along with economic data releases before the market opens in the morning. While these events might spark some volatility, I personally do not expect any significant price moves as a result.
Weekly Earnings Outlook
This week doesn’t offer many exciting earnings events, but we work with what we have – and there are still some interesting opportunities to explore.
Tradingview 1-click save: https://www.tradingview.com/watchlists/169527590/
ZOOM
ZM 0.00%↑ reports right after the market close on Monday. It's worth noting that call options are currently twice as expensive as put options, with both IVR and IV steadily climbing. This strong bullish setup is no surprise.
However, GEX levels aggregated across all expirations suggest caution around the 95 mark for overly optimistic traders. That said, never underestimate the power of FOMO: in the event of a gamma squeeze, we can see the next call wall building at the 100 level, which aligns with our 8/8 grid level, indicating a strong resistance zone. Either way, I certainly wouldn’t want to be on the short side for this earnings event.
NORDSTROM
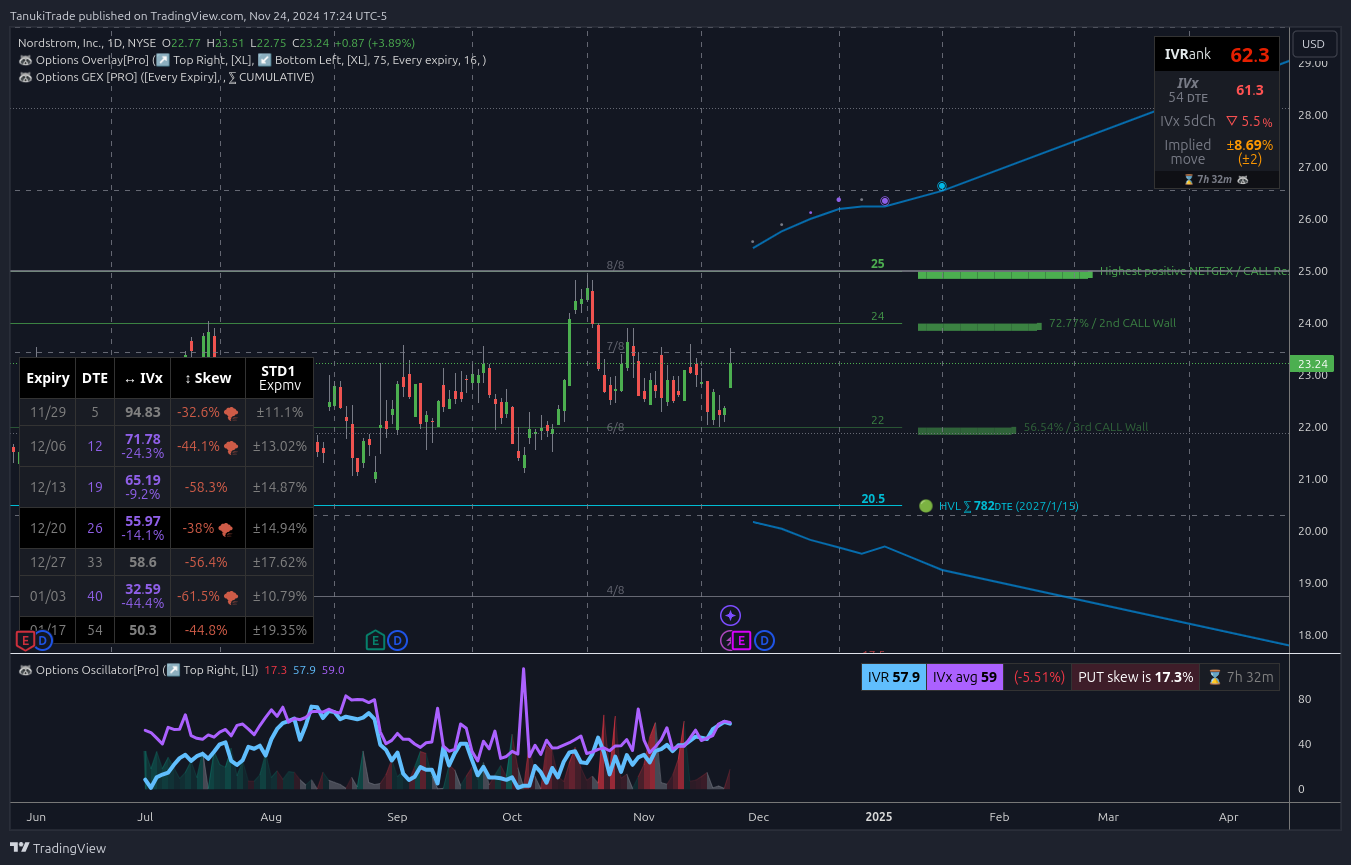
What grabs my attention more is JWN 0.00%↑ , which reports after the close on Tuesday. The growing put pricing skew is notable, despite the stock being in a positive GEX zone.
Call resistance is positioned at the previous high of 25. The stock's relatively low price could provide an opportunity to capitalize on the post-earnings 45–60 DTE put skew. In this case, a jade lizard or short put ratio strategy will be worth considering for me after the earnings release.


MSTR educational example is in 192$ profit for now (few hours after publishiung newsletter). I would scaling out or running away with profit: https://optionstrat.com/qG0EcAXAfBu2