


12/16 Weekly Insights: SPX & QQQ Analysis and Educational Trade Ideas
This week’s newsletter continues our weekly options market analysis, focusing on the final active trading stretch of the year, exploring the impact of gamma levels on SPX and QQQ price dynamics

We have finally arrived at the last truly active trading week of the year. Typically, the week before Christmas marks the final period of heightened market activity, as major players usually refrain from trading between the holidays.
Our educational restructuring last week proved successful. Those who observed and analyzed the tested diagonal strategy as part of the educational process could have theoretically achieved a profit of approximately $200–$400, thereby confirming the effectiveness of the approach.
SPX analysis
Now, let’s take a look at the expected SPX trading range for the week based on the auto GEX levels for TradingView:
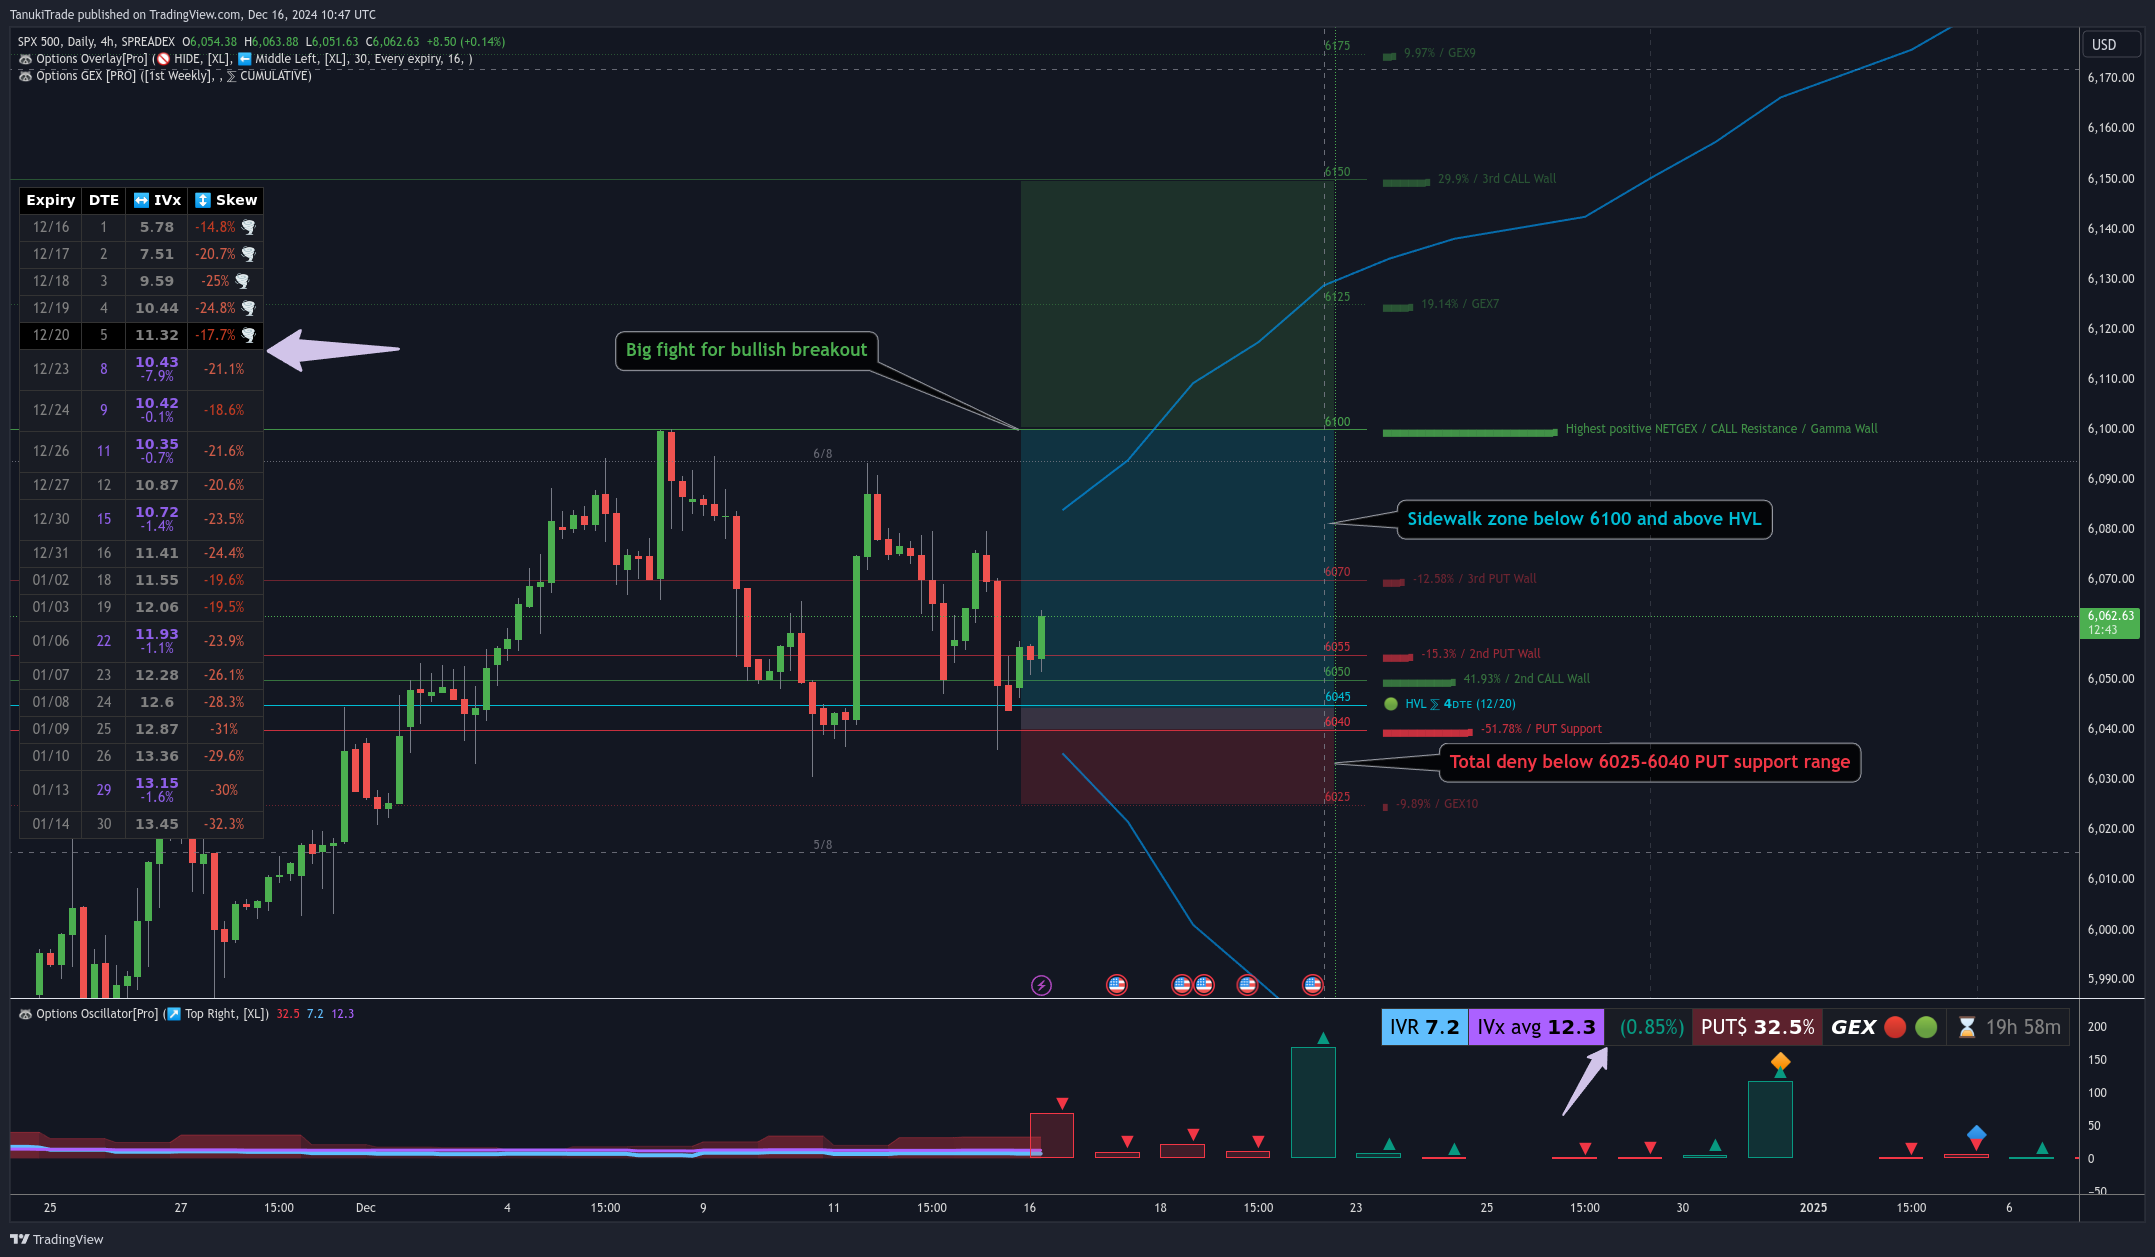
It’s clear that we’re currently in positive gamma territory, primarily due to the December 20 expiration. However, the mid-week expirations leading up to that date remain in negative gamma territory, a direct result of last week’s bearish moves—though this can change within a single day.
Looking ahead to Friday, we expect a range-bound, more predictable trading environment, likely holding above 6045 and below 6100 based on current levels.
IVR and IVx remain low, and we don’t anticipate any increase before Christmas unless the market reaches the “total deny zone” between 6025 and 6040.
The greatest IV backwardation is present between December 20 and December 23, as average IV ticked up slightly following last week’s bearish action. This makes that particular expiration combination potentially appealing for time spread strategies.
Stay alert! The deny zone is near, and a quick move through the HVL could suddenly disrupt what currently appears to be a relatively predictable trading range. Conversely, a breakout above 6100 could spark a permabull end-of-year rally to the upside.
Weekly Educational Positions
It’s important to emphasize that I do not recommend anyone blindly following these trades. The positions shared in the newsletter serve solely to illustrate, over time, what happens to a given time spread, helping you gain a better understanding of their behavior.
Weekly Low-Cost 4/7 DTE SPX OMNI-BULLISH Expirement
This week, purely for educational purposes, I thought we could take a look at a 1:1 calendar-diagonal combination using a paper trading account and see how it performs through Friday.
Position: SPX Dec 20th – Dec 23rd 6105/6100 (1:1 Calendar + Diagonal)
Max Loss: $280
Max Profit: $3,700
Probability of Profit (PoP): 60%
OptionStrat link to observe experiment: https://optionstrat.com/ayvOrQABYVEp
We can see that this is a relatively low-cost setup with a roughly +1.9 delta, making it a mildly omni-bullish position. However, one must be extremely cautious. If the price drops toward the 6000 level, this position can quickly lose half its value. In such a scenario, it makes little sense to hold onto it, as it’s specifically designed for a sideways-to-bullish outlook. If you’re nervous about a potential breakdown due to a nearby HVL, it might be wise to reconsider avoid this position. Understand the risks fully before proceeding.
Management Guidelines:
If the short leg at 6100 is reached, consider closing the position.
If there’s a 50% loss (around the 6020 area), consider a full close and take loss.
Next week, I’ll use this trade to demonstrate why even break-even levels are not as straightforward as initial simulations suggest. Among all spread types, time spreads are some of the trickiest to navigate.
Weekly Low-Cost QQQ BEARISH Experiment
To avoid only showcasing bullish time spreads, let’s take a look at something more exotic: a QQQ 0.00%↑ omni-bearish put calendar.
First, let’s examine what we see on our chart using the TanukiTrade options indicators:

Summarizing the GEX levels through December 26, we have a strong call wall at around 530. If price can break above and hold that level, it could easily pave the way toward 535. However, if we’re expecting a Christmas selloff after Friday’s close, this bearish assumption might prove worthwhile.
This brings up a point that often comes up:
“How do I interpret whether the indicator is bullish or bearish?”
There’s no such definitive signal! The levels and options metrics show certain conditions, but no one can tell you exactly what will happen next. This is where you need to have a directional hypothesis. Once you have it, the indicators can help you fine-tune your positioning, identify realistic targets, and select viable legs—but they won’t decide your directional stance for you.
For example, while everything may look bullish, let’s say you have a contrarian bearish view. Then you can see where it makes sense to position yourself using the provided indicators.
Test Case Chosen:
8x QQQ Dec 24th – Dec 26th 525 Calendar Put Spread
Max Loss: $216
Max Profit: $1,685
PoP: 45%
OptionStrat link to observe experiment: https://optionstrat.com/zeLCvF5eAYG1
This setup carries a stronger negative delta, specifically around -5. Preliminary simulations indicate that the interim break-even point sits below 536. I’ve placed the short leg just below the HVL and the put support, still within the 16-delta OTM range. This positioning could be a logical for a bearish assumption, as the underlying maybe won’t easily approach that level during a potential selloff due to the put support.
Risk management is similar to the previous example: we don’t want to lose more than half the debit. If the 565 call gamma wall doesn’t hold, I certainly wouldn’t keep this position open. As for profit-taking, if we’re within three days of the front expiration and the short leg gets hit, there’s no point in holding any longer.
Educational Outlook
I hope this gives you some insight into my mindset.
Next year, I’m not only planning to show time spreads in my newsletters but also flat butterflies and other positions designed to target delta neutrality and flexible adjustments.
This will help illustrate the true essence of GEX levels: not to predict what will happen, but to guide us in adopting a delta-neutral, market-maker mindset. By understanding and following the “reaction zones” each day, you gain a valuable perspective on the market’s dynamics.
great article... looking forward to your first post of 2025.. would be good to see some butterflies too and different IV Rank conditions too. cheers!
Great newsletter, thank you!