TanukiTrade Weekly Newsletter 8/12/24
Each week, we break down everything you need to know about the stock market for the week ahead, whether you're an active or passive trader.
As expected, after the big spike, the VIX calmed down throughout the week.
For those who followed last week’s newsletter, the short-term credit put ratio spreads were the stars. I successfully closed two of my positions in summary $304 profit. Details are [here] and [here] on my shared Tradersync profil.
If we look at the $SPX daily chart and the options chain using the Options Overlay indicator, we can see that the OTM PUT with a 16 delta is below the symmetric Exp.mv + STD1 probability curve. This results in a put delta skew twist. This means that market participants are still pricing in a very strong bearish move based on the SPX options chain.
In the event of a further correction, we can already see on the daily chart that the $4700-$5000 price zone could be a significant support due to the 4/8 level below.
If buyers appear on the SPX despite all the challenges, the next 6/8 level on the upside is still quite far away. In my experience, climbing back to the ATH would be slower.
Nevertheless, the options chain pricing suggests that the 88% PUT pricing skew at 40 DTE is so strong that the majority are still pricing in a downward move.
Macro view of QQQ - recap
What I find most interesting is how QQQ 0.00%↑ bounced so nicely off the upward trendline on the 3Day chart. This is surprising because all the news outlets were talking about a tech sector selloff, yet it seems buyers stepped in strongly to defend the bullish trendline.
This perfectly illustrates the reliability of our options grid system when it comes to major horizontal lines. We bounced off the 4/8 level, and the 8/8 level was already marked during the previous breakout. When the peak was reached, our options grid system automatically rescaled and plotted the 4/8 major support level, from which the price bounced.
Just like any indicator, ours can't predict the future—it's not a crystal ball. However, when it comes to day-by-day trading, I find it hard to imagine searching for target levels without it.
Economic Calendar & Earnings
This week has a few event risks according to the economic calendar. The most important is the CPI data on wednesday, but the Thursday could be also volatile day.
source: investing.com
Earnings season final with Chinese players
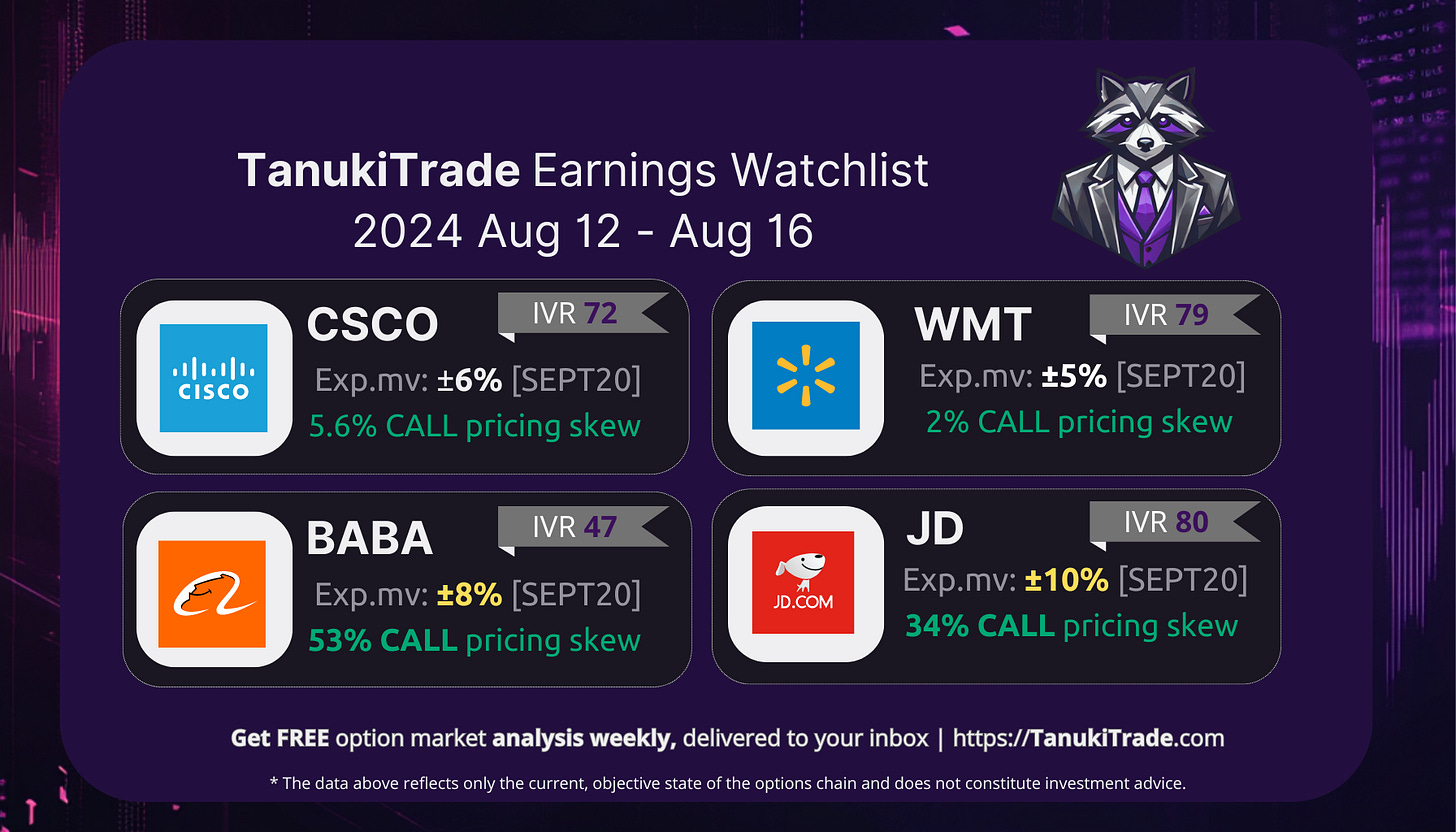
The earnings season is coming to an end. The stocks on my watchlist that are also included in the TanukiTrade Options indicator are: GOLD 0.00%↑ CSCO 0.00%↑ , BABA 0.00%↑ , and WMT 0.00%↑ .
Right now, for the September expiration, we see the following expected move and IV data on our TradingView screener (these are pre-market numbers from Monday, so they may change throughout the week):
Because of the volatile and unpredictable environment, I wouldn't trade them necesssary before earnings. Instead, I'm focusing on strategies to take advantage of the IV drop right after earnings, especially if there’s an interesting gap down. (jade lizard, strangle, IC)
These above, BABA 0.00%↑ and JD 0.00%↑ are the most interesting to me. The high vertical CALL pricing skew on the options chain shows that the CALL options for the September expiration are already much more expensive than the PUT options at the same expected move distance. This suggests that market participants are pricing in an upward move.
Let's take a closer look at the probability curve formed by the options chain. I'm very curious to see whether the 8/8 to +1/8 quadrant line will hold the price for BABA, or if it will continue to surge into the Upper Extreme quadrant, heading towards +4/8.
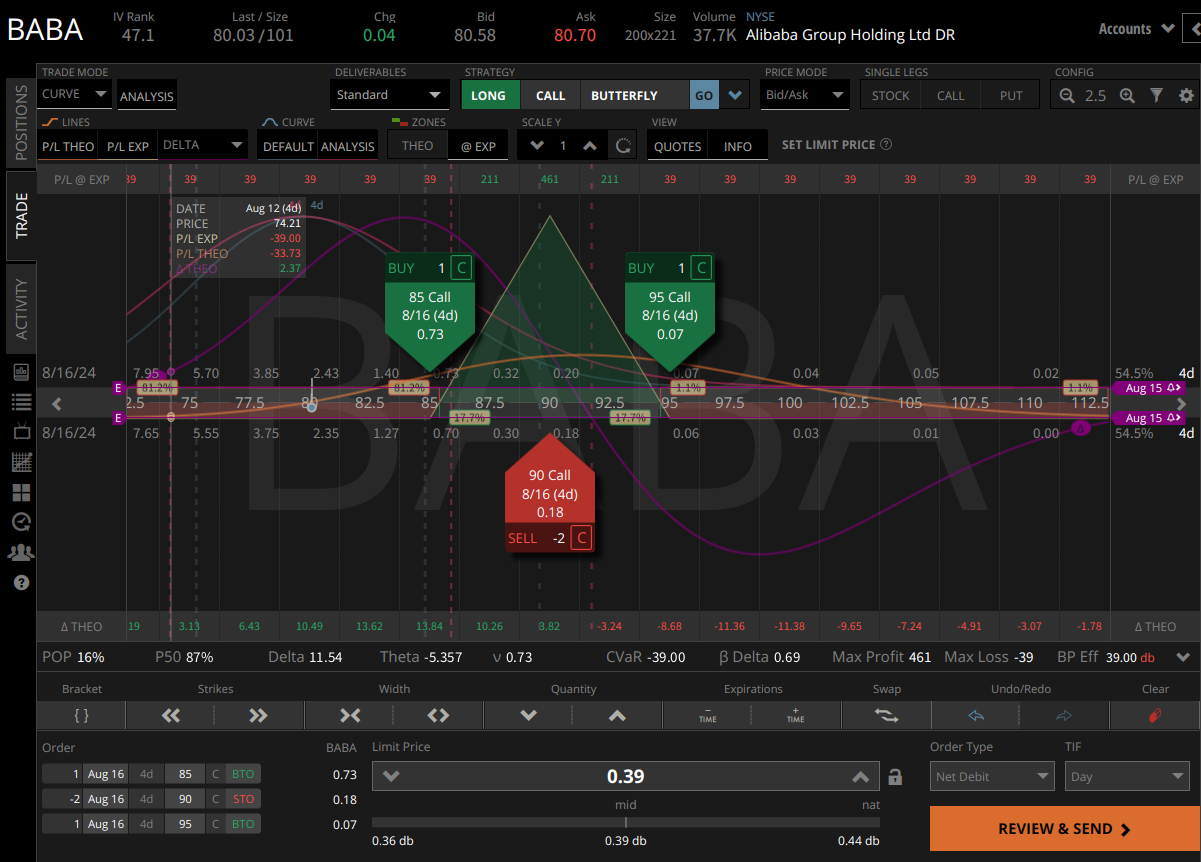
If everything stays the same, something like this could be an interesting lottery ticket for me. I'm thinking about an OTM call butterfly with a short expiration before earnings.
I have to admit, I’m not a big fan of risking on this red/black roulette type of play, but if things stay as they are, I might consider combining it with a 40 or 68DTE credit put ratio below and the call butterfly above before earnings.
But we'll see how things look on the day before earnings!
Weekly Poll on TanukiTrade Toolkit Expansion
I've posted the weekly poll on which symbols to add to the indicators this week. Based on this week's earnings and liquidity, the symbols I'm considering that haven't been implemented yet are: AMAT 0.00%↑ , NU 0.00%↑ , RDDT 0.00%↑ , DE 0.00%↑ , HD 0.00%↑ .
If you're interested and have a preference, cast your vote in our official Reddit group.
Best Regards
Gregory P Szilagyi
Founder of https://tanukitrade.com
🏆 [CONTEST]
I've published my small account challenge. I started 2024 with a $12,000 account, and my goal is to reach $25,000 by the end of the year. After closing, I’ve shared all my trades, the losing ones as well as the winning ones, as we learn from them.
If someone tells you they only have profitable trades, then something isn't right….. The key is: sizing & proper risk management.
Check my journey stats live on tradersync or follow via weekly newsletter .
🔥 [EXCLUSIVE]
I'm supercharging my TradingView charts with the TanukiTrade Options Overlay indicator for every setup.
🚀 Experience the power of this tool for yourself with a Free trial on 5 US market symbols on TanukiTrade.com


